Federal Income Taxes on Middle-Income Families Remain Near Historic Lows
Federal taxes on middle-income Americans are near historic lows,[1] according to the latest available data. That’s true both for federal income taxes and total federal taxes.[2]
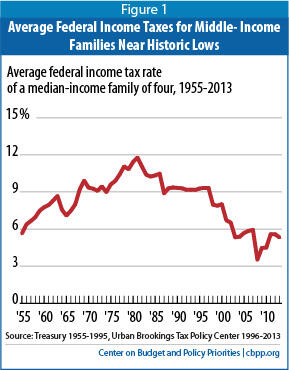
- Income taxes: A family of four in the exact middle of the income spectrum filing its taxes for 2013 this filing season paid only 5.3 percent of its 2013 income in federal income taxes, according to estimates from the Urban-Brookings Tax Policy Center (TPC).[3] Average income tax rates for these typical families have been lower during the Bush and Obama Administrations than at any time since the 1950s. (See Figure 1.) As discussed below, 2009 and 2010 were particularly low because of the temporary Making Work Pay Tax Credit.
- Overall federal taxes: Overall federal taxes — which include income, payroll, and excise taxes, and imputed corporate taxes — on middle-income households in 2009 were at their lowest levels in decades, according to the latest data from the Congressional Budget Office (CBO).
Federal Income Taxes Have Declined Significantly in Recent Decades
The 5.3 percent rate (as well as the other rates discussed here for 2013 and other years) is the effective tax rate, or the percentage of its income that a family pays in taxes. It is well below the 15 percent marginal tax rate — the rate paid on a filer’s next dollar of income — that a family of four in the exact middle of the income spectrum faces. A family’s effective tax rate typically is significantly lower than its marginal tax rate because the family takes the standard deduction (or, in some cases, itemized deductions), personal exemptions, and tax credits such as the child tax credit, and because a portion of the family’s taxable income is taxed at lower rates. (For the median-income family, some of its income is not taxed, some is taxed at a 10 percent rate, and some is taxed at a 15 percent rate.)
Expiration of Temporary Tax Breaks Raised Effective Income Tax Rate
Figure 1 shows that while the overall trend in a typical family’s effective tax rate has been downward, the 2013 rate is above the rates for 2008-2010. This is because of the expiration of the Recovery Rebate Credit of 2008 and Making Work Pay Tax Credit of 2009 and 2010.
In 2008, policymakers enacted a one-time income tax rebate up to a maximum of $1,200 for married couples filing jointly.[5] The following year they enacted the Making Work Pay Tax Credit as part of the 2009 Recovery Act; it provided an income tax credit of up to $800 to married couples ($400 to single filers) in 2009 and 2010.
Expiration of Payroll Tax Cut Is Biggest Tax Change for Most People in 2013
In 2011, policymakers shifted their tax-cutting stimulus focus from the income tax to the Social Security payroll tax. They allowed the income-tax-based Making Work Pay credit to expire and, in its place for 2011 and 2012, cut the employee portion of the Social Security payroll tax from 6.2 percent to 4.2 percent of workers’ Social Security taxable earnings (which were capped at $110,100 in 2012). The payroll tax cut did not adversely affect Social Security’s finances because general revenue transfers to the Social Security trust funds offset the loss of payroll tax revenue.
This payroll tax cut expired at the end of 2012. This was the most significant tax change for most people in 2013 (Table 1 highlights the tax cut’s value for workers in various occupations). A number of studies, including estimates by the Congressional Budget Office, suggest that the expiration of the payroll tax cut contributed to slower consumption and gross domestic product (GDP) growth in 2013.[6]
| Table 1 Effect of Payroll Tax Cut in 2012 | ||
| Occupation | Average Salary* | Amount of Payroll Tax Cut |
| Cashier | $20,370 | $407 |
| Home health aide | $21,830 | $437 |
| Hairdresser | $26,790 | $536 |
| Truck Driver | $40,360 | $807 |
| Machinist | $40,860 | $817 |
| Plumber | $52,950 | $1,059 |
| Electrician | $53,030 | $1,061 |
| Nurse | $67,930 | $1,359 |
| Computer Programmer | $78,260 | $1,565 |
| Real Estate Broker | $80,220 | $1,604 |
| Marketing Manager | $129,870 | $2,202** |
| * Bureau of Labor Statistics May 2012 National Occupational Employment and Wage Estimates, http://www.bls.gov/oes/current/oes_nat.htm. | ||
Overall Federal Taxes Also at Low Levels
While income taxes on middle-class households have declined in recent years, so, too, have overall federal taxes.
Households in the middle fifth of the income spectrum paid an average of 11.5 percent of their income in overall federal taxes in 2010, the latest year for which data are available, according to CBO.[7] This is the lowest on record in data that go back to 1979. When CBO publishes data for more recent years (such as 2013), overall federal average tax rates on this middle group will likely be higher — though still low historically — because they will reflect the expiration of the temporary income and payroll tax cuts discussed above.
Most Americans pay more in payroll taxes, which support Social Security and Medicare, than they do in income taxes. In a typical, non-recession year (that is, one without a temporary tax cut), payroll taxes amount to about 9 percent of income for households in the middle quintile, according to CBO.[8]
End Notes
[1] Urban-Brookings Tax Policy Center (TPC), “Average and Marginal Federal Income Tax Rates for Four-Person Families at the Same Relative Position in Income Distribution, 1955-2013,” April 3, 2013. TPC derived its estimates by updating (using Treasury’s methodology) a 1998 Treasury Department analysis that examined changes since 1955 in the percentage of income that the median-income family of four pays in federal income taxes. Income tax rates on many higher-income people are also historically low; TPC estimates that the rates for a family of four at twice the median income level have been lower in recent years (including 2013) than at any time since the 1960s.
[2] Congressional Budget Office, “The Distribution of Household Income and Federal Taxes, 2008 and 2009,” July 10, 2012, http://www.cbo.gov/publication/43373.
[3] Tax Policy Center, http://www.taxpolicycenter.org/taxfacts/displayafact.cfm?Docid=226.
[4] Ibid.
[5] The full text of H.R. 5140, the Economic Stimulus Act of 2008, is available at http://www.gpo.gov/fdsys/pkg/PLAW-110publ185/html/PLAW-110publ185.htm.
[6] Congressional Budget Office, “The Budget and Economic Outlook: Fiscal Years 2013 to 2023,” February 5, 2013, http://www.cbo.gov/publication/43907. See also Chuck Marr, “Congress Must Extend Unemployment Insurance: Here’s Another Reason Why,” Off the Charts Blog, Center on Budget and Policy Priorities, December 5, 2013, http://www.offthechartsblog.org/congress-must-extend-unemployment-insurance-heres-another-reason-why/.
[7] The CBO study covers the 1979-2010 period and includes federal income, payroll, excise, and imputed corporate taxes. Congressional Budget Office, “The Distribution of Household Income and Federal Taxes, 2010,” December 4, 2013, http://cbo.gov/publication/44604. The 11.5 percent rate is the average for the middle income quintile, which may differ from the median value for the population.
[8] CBO estimates that, on average, households in the middle quintile paid 8.9 percent of their income in payroll taxes in 2007.
More from the Authors