House 2017 Budget Plan Would Slash SNAP by More Than $150 Billion Over Ten Years
Low-Income Households in All States Would Feel Sharp Effects
The House Budget Committee-approved budget plan would cut the Supplemental Nutrition Assistance Program (SNAP, formerly known as the Food Stamp Program) by more than $150 billion — over 20 percent — over the next ten years (2017-2026). A cut of this magnitude would necessitate ending food assistance for millions of low-income families, cutting benefits for millions of these households, or some combination of the two.[1] The committee has proposed similarly deep SNAP cuts in each of its last five budgets. This year’s budget has two categories of SNAP cuts:
- It includes three major benefit cuts that Congress ultimately rejected from House-passed versions of the 2014 farm bill. They would terminate benefits to about 3 million low-income people — including many working families, senior citizens, and people with disabilities, and some of the poorest Americans — and cut SNAP spending by more than $25 billion over ten years (2017-2026).[2]
- It would convert SNAP into a block grant beginning in 2021 and cut funding steeply — by $125 billion (or almost 30 percent) over 2021 to 2026. States would be left to decide whose benefits to reduce or terminate. They would have no good choices, since SNAP benefits average only $1.41 per person per meal and go primarily to poor children, working parents, seniors, people with disabilities, and others struggling to make ends meet.
The cuts would come on top of SNAP cuts that occurred in recent years or are occurring under current law.The cuts would come on top of SNAP cuts that occurred in recent years or are occurring under current law.
- More than 500,000 and up to 1 million of the nation’s poorest people will be cut off SNAP over the course of 2016 as a three-month limit on SNAP benefits for unemployed adults aged 18-49 who aren’t disabled or raising minor children returns in many areas. These individuals, whose average income while on SNAP equals just 17 percent of the poverty level, will lose food assistance after three months regardless of how hard they are looking for work.[3]
- Nearly all SNAP recipients experienced a benefit cut averaging 7 percent in November 2013 when the 2009 Recovery Act’s temporary benefit increase expired. The cut totaled about $5 billion in fiscal year 2014.[4]
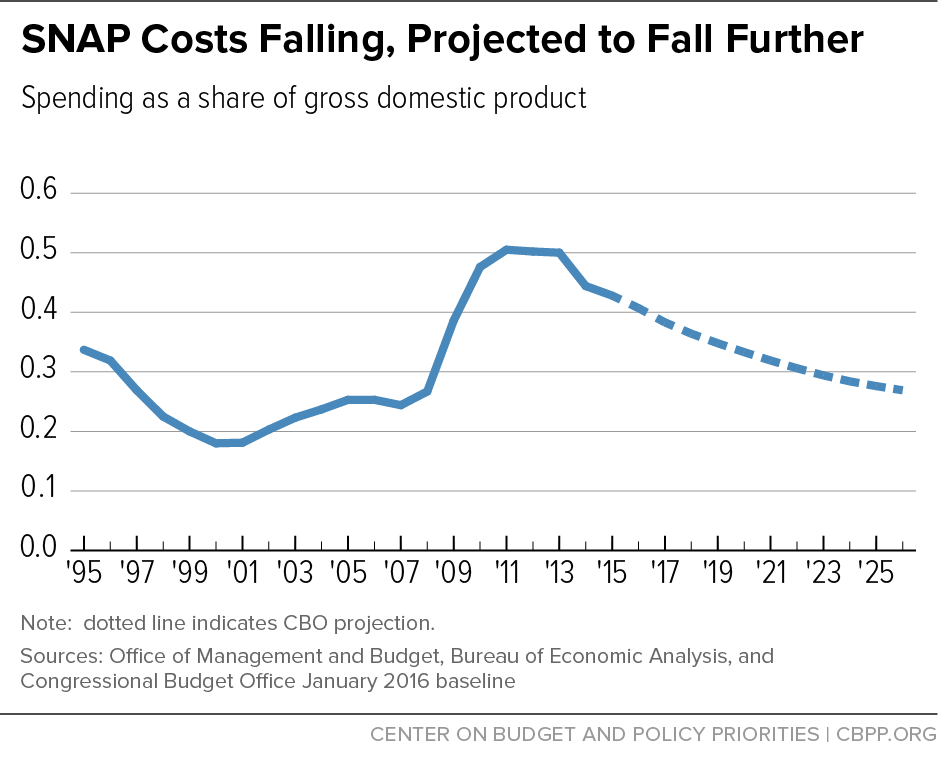
Claims that cuts are needed to rein in SNAP are misplaced. As it was designed to do, SNAP expanded to meet growing need in the wake of the Great Recession. But SNAP caseloads and spending have since begun falling. The number of SNAP recipients shrank by 2.6 million people in the three years after peaking in December 2012, and the Congressional Budget Office (CBO) expects SNAP spending to return to its 1995 level as a share of gross domestic product (GDP) by 2020 under current law.[5]
Block Grant Would Force States to Cut Food Assistance Deeply
Roughly 90 percent of SNAP spending goes for food assistance, and most of the rest covers state administrative costs to determine program eligibility and operate SNAP properly. Therefore, policymakers couldn’t achieve cuts of the magnitude in the House Budget Committee’s block grant without substantially scaling back eligibility or reducing benefits deeply, with significant effects on low-income people.[6] Table 1 provides state-by-state estimates of the potential impact.
-
Eligibility cuts. If the cuts came solely from eliminating eligibility for certain categories of households or individuals, states would have to cut an average of 10 million people from the program (relative to SNAP enrollment without the cuts) each year between 2021 and 2026.[7]
States also could tighten SNAP eligibility by lowering the program’s income limit. To achieve a 29 percent cut in overall benefits paid (as the House budget would, beginning in 2021), the SNAP income limit would have to be set at about 68 percent of the poverty level, or about $13,078 a year in 2016 dollars for a family of three. The current federal limit is 130 percent of the poverty level. This approach would eliminate eligibility for many working families, senior citizens, and people with disabilities.[8]
-
Benefit cuts. If the cuts came solely from across-the-board benefit cuts, states would have to cut an average of more than $40 per person per month in 2021 to 2026 (in nominal dollars). This would require setting the maximum benefit at about 77 percent of the cost of the Thrifty Food Plan, the Agriculture Department’s (USDA) estimate of the cost of a bare-bones, nutritionally adequate diet. (SNAP’s maximum benefit, which goes to households with no disposable income after deductions for certain necessities, is set at 100 percent of the Thrifty Food Plan.)[9]
Such a change would have a pronounced impact. All families of four — including the poorest — would face benefit cuts of about $165 a month in fiscal year 2021, or almost $2,000 per year. All families of three would face cuts of about $130 per month, or almost $1,550 per year. Policymakers could shield some households from cuts, but then other households would need to bear even larger cuts in order to produce the $125 billion in block-grant savings.
While states might not seek to hit the targets through just one of these approaches, these examples illustrate the magnitude of the reductions needed. States would have few other places to achieve the required cuts. In 2015, 90 percent of SNAP spending went for benefits to purchase food. Another 6 percent went for administrative costs, including reviews to determine that applicants are eligible, monitoring of retailers that accept SNAP, and anti-fraud activities. The rest went for other food assistance programs, such as the block grants for food assistance in Puerto Rico and American Samoa, commodity purchases for the Emergency Food Assistance Program (which helps food pantries and soup kitchens across the country), and commodities for the Food Distribution Program on Indian Reservations.
Three Other SNAP Cuts Would Affect Millions of Americans
According to House Budget Committee staff, the budget resolution assumes, in addition to the $125 billion cut from the block grant, three additional cuts that Congress considered and rejected during the debate on the 2014 farm bill. They would throw off SNAP some of the nation’s most destitute adults living in areas with high unemployment, as well as many low-income seniors, people with disabilities, and families with children working for low wages. All three would eliminate existing state options in SNAP. The people the bill would cut off SNAP include:
-
About 1 million childless adults living in areas of high unemployment. This group has average income of only 17 percent of the poverty line (about $2,000 a year for a single individual), and SNAP is the only government assistance that most of them receive.
Currently, childless adults aged 18-49 who are not disabled and are not working at least 20 hours a week or participating in a qualifying workfare or job training program can receive SNAP for only three months in any 36-month period. States may seek temporary waivers from the time limit for areas with high unemployment, where jobs are scarce.
As noted previously, under current law more than 500,000 and up to 1 million people are slated to be cut off SNAP over the course of 2016 because their area no longer qualifies for a waiver or their state has opted not to renew it. The budget resolution would eliminate waivers altogether, so the time limit would apply even in areas with very high unemployment. This change would cut SNAP by $14 billion over the ten years, according to budget committee staff.
- About 2 million people, mostly low-income working families and low-income seniors, who would lose SNAP due to the elimination of another state option known as broad-based categorical eligibility. This cut targets households with gross incomes or assets modestly above the federal SNAP limits but disposable income — the income that a family actually has available to spend on food and other needs — below the poverty line in most cases, often because of high rent or child care costs. In addition, several hundred thousand children in these families whose eligibility for free school meals is tied to their family’s receipt of SNAP would lose free school meals. CBO has estimated this change would cut SNAP by about $10 billion over ten years.[10]
The third provision would restrict states’ ability to use an important program simplification that reduces paperwork in determining SNAP benefit levels for households receiving benefits from the Low Income Home Energy Assistance Program (LIHEAP). The affected households, whose benefits would be cut because they no longer could document that they qualify for a utility allowance, would disproportionately be low-income seniors, people with disabilities, and working-poor families with children.
How SNAP Cuts Might Be Considered
Two elements of the House Budget Committee-approved budget resolution could affect how SNAP cuts might be considered in the House:
- The budget resolution calls on five House committees — including the Agriculture Committee, which has jurisdiction over SNAP — to recommend cuts in entitlement programs totaling at least $140 billion over ten years. Although no definite plans have been announced, this package of cuts, sometimes referred to as a “side car,” could be considered at the same time as the budget resolution or separately at a different time. Two of the five committees — Energy and Commerce and Ways and Means — have already approved packages of cuts, primarily in programs assisting low- and moderate-income people. The Agriculture Committee might choose to include SNAP cuts in its contribution to that $140 billion total.
-
The budget resolution also includes separate instructions for “reconciliation,” a special, fast-track process intended to facilitate passage of large deficit-reduction packages.a The Agriculture Committee is one of 12 committees instructed to achieve savings. The instructions call for only small savings from each committee — $1 billion over ten years for the Agriculture Committee, for example — which suggests that these targets are a floor rather than a ceiling. The Agriculture Committee could recommend much larger SNAP cuts as part of reconciliation.
However, reconciliation procedures require the House and Senate to agree on a budget plan, and few think the Senate will act on a budget plan this year. Thus, there is little expectation that reconciliation will happen this year.
a For more on reconciliation, see David Reich and Richard Kogan, “Introduction to Budget ‘Reconciliation,’” Center on Budget and Policy Priorities, January 22, 2015, https://www.cbpp.org/cms/index.cfm?fa=view&id=5262
Proposed Cuts Rest on Inaccurate Claims
The House Budget Committee plan bases its proposed SNAP cuts on a series of inaccurate claims and inferences about SNAP’s growth and effectiveness. The plan’s only specific reference to the SNAP cut argues that:
Funding for the Supplemental Nutrition Assistance Program (SNAP), has grown from $18 billion in 2001 to $74 billion in 2015. Too many people are becoming trapped in the program with no way to get out. At the same time, states simply do not have the flexibility or authority to improve the program and address this cycle of dependency.[11]
The reality is quite different:
-
Caseloads and spending are declining. SNAP caseloads grew substantially during the recession but have declined for the past several years. As of December 2015, the number of SNAP participants had fallen by 2.6 million people since peaking three years earlier (in December 2012). CBO projects that SNAP caseloads will fall from 45.8 million people in fiscal year 2015 to 33.1 million in 2026.
SNAP spending grew sharply after 2007 due to three factors: the depth of the Great Recession and the slow, uneven recovery, which made more people eligible; improvements in reaching eligible households, particularly working-poor families; and the 2009 Recovery Act’s temporary benefit boost, which ended in November 2013.[12]
As Figure 1 shows, SNAP spending is falling as a share of GDP, and CBO projects it will return to close to pre-recession levels once the economy fully recovers. SNAP does not contribute to the nation’s long-term budget problems because it is projected to grow no faster than the economy over time.
Figure 1
CBO projects that SNAP costs, when adjusted for overall inflation (rather than measured as a share of GDP), will remain higher than before the recession. CBO has not detailed its assumptions, but they likely include: 1) participation rates among those eligible will remain somewhat higher than before the recession; 2) some of the weakness in the labor market stemming from the recession will continue; 3) food price inflation will exceed overall inflation over the 2017-2026 period; and 4) the overall U.S. population will continue to grow. These factors indicate that SNAP is working as intended to meet need.
The House Budget Committee plan to drastically cut SNAP funding and turn SNAP over to the states would leave the program much less responsive to changing economic conditions.
-
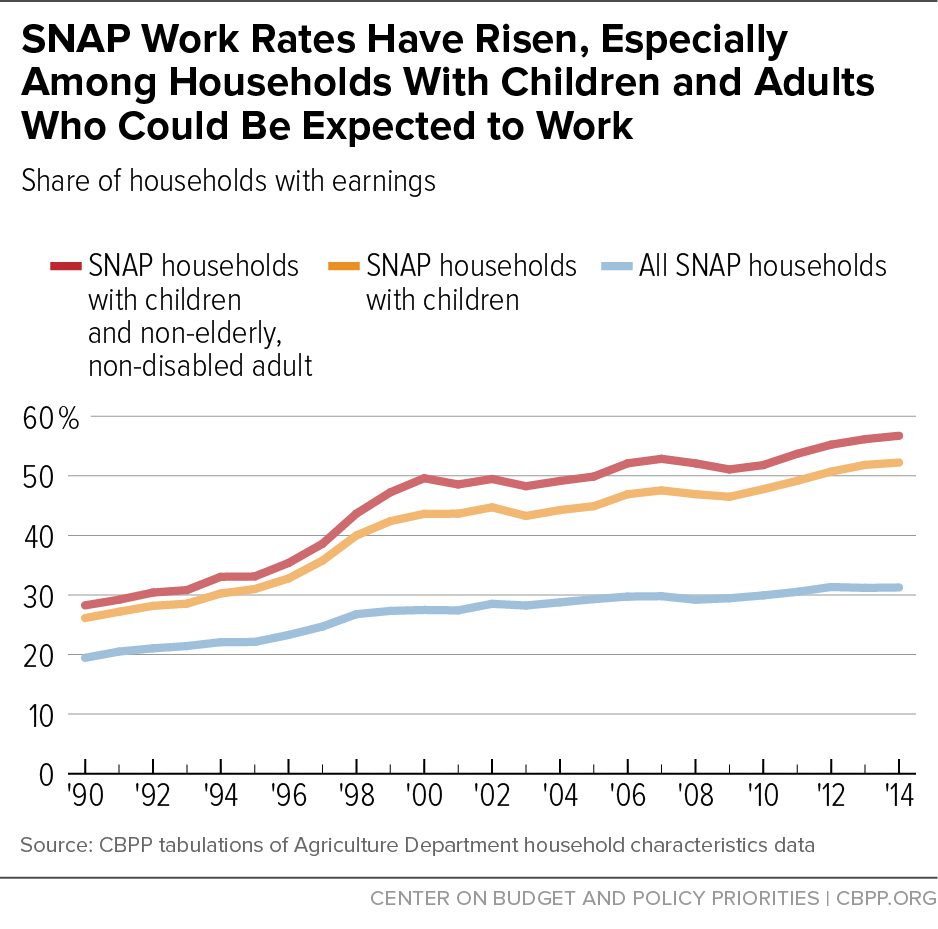
SNAP supports work. In addition to acting as a safety net for people who are elderly, disabled, or temporarily unemployed, SNAP supplements the wages of low-income workers and their families. The number of SNAP households that have earnings while participating in SNAP has more than tripled, from about 2 million in 2000 to about 7 million in 2014. The share of all SNAP households that have earnings while participating in SNAP also rose over that period, from about 27 percent to about 31 percent. (See Figure 2.)
Figure 2
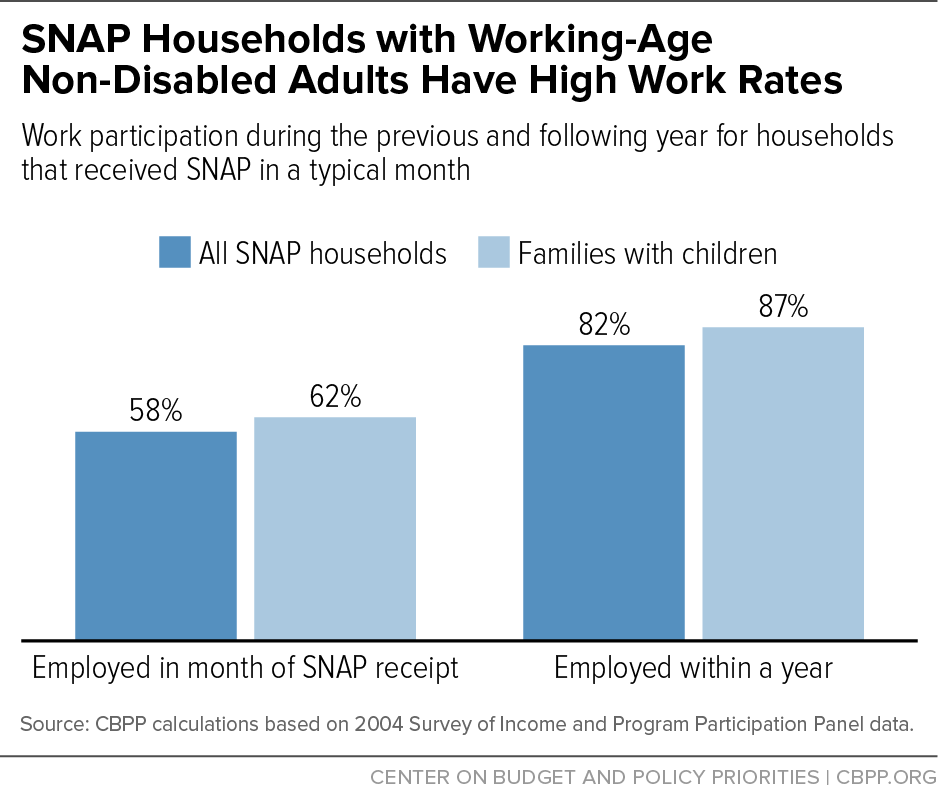
Moreover, most SNAP recipients who can work do so. Among SNAP households with at least one working-age, non-disabled adult, more than half work while receiving SNAP — and more than 80 percent work in the year before or after receiving SNAP. (See Figure 3.) The rates are even higher for families with children. (About two-thirds of SNAP recipients are not expected to work, primarily because they are children, elderly, or disabled.)[13] Thus, far from “trapping” workers in dependency as critics claim, SNAP supports workers.
Figure 3
- States have considerable flexibility in administering SNAP, within federal standards. SNAP is a highly effective anti-hunger program that is administered with relatively low overhead and a high degree of payment accuracy. Much of its success in responding to need and reducing hardship is due to a consistent national benefit structure, rigorous requirements on states and participants to ensure a high degree of program integrity, and a focus on providing food assistance. Nonetheless, Congress and USDA have given states flexibility where it would enhance the program without weakening SNAP’s success. In particular, states have significant flexibility in how they administer SNAP and coordinate with other human services programs. They also have a number of options concerning SNAP eligibility — three of which the budget resolution would eliminate.[14]
Benefit Cuts Would Primarily Affect Low-Income Workers, Families With Children, Seniors, and People With Disabilities
The House budget documents assert that Congress could achieve the required savings by converting SNAP into a “State Flexibility Fund tailored for each state’s low income population” and giving states “the flexibility [and] authority to improve the program and address this cycle of dependency.” That description gives the mistaken impression that states could produce large savings without significantly harming millions of vulnerable Americans.
Unlike most means-tested benefit programs, which are restricted to particular categories of low-income individuals, SNAP is broadly available to almost all households with very low incomes. Cutting SNAP would affect broad swaths of the low-income population. Currently, about 45 million people receive SNAP to help them feed their families. Census data show that in 2014 (the latest year available), 47 million Americans lived below the poverty line and 65 million lived below 130 percent of the poverty line, SNAP’s gross income limit.[15]
-
The overwhelming majority of SNAP households are families with children, seniors, or people with disabilities. Close to seventy percent of SNAP participants are in families with children; more than one-quarter are in households that include senior citizens or people with disabilities.
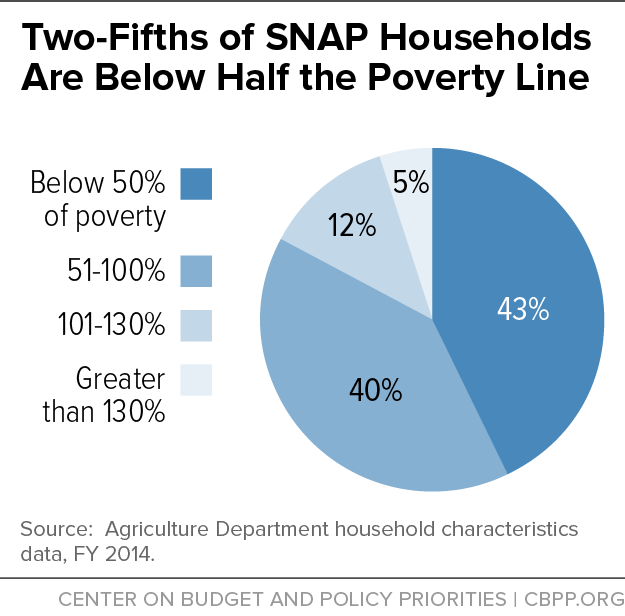
Figure 4 -
SNAP households have very low incomes. Eighty-three percent of SNAP households have incomes below the poverty line while receiving SNAP assistance (about $20,160 for a family of three in 2016). Forty percent of SNAP households have incomes below half of the poverty line. (See Figure 4.) Such households have little flexibility in their monthly budgets to cope with deep reductions in food assistance.
Low-wage workers rely on SNAP to boost their monthly income. Millions of Americans live in working households with earnings that are not sufficient to meet basic needs. In 2014, some 38 million people (1 in 8 Americans) lived in a working family with cash income below 130 percent of the poverty line.[16] Wage growth has been sluggish since the recession due to labor market slack; with many more job-seekers than jobs, employers have faced little pressure to raise wages. Low-wage workers likely to qualify for SNAP have yet to see their wages catch up; their real (inflation-adjusted) wages were lower in 2015 than in 2009.[17] In addition, the share of workers who work part time but would like a full-time job remains high. Working families with low incomes often cannot afford necessities like food and housing without some assistance.
SNAP benefits play a crucial role in boosting such families’ monthly resources: in 2014, a typical working mother with two children on SNAP earned $1,180 per month ($14,175 on an annual basis) and received $331 per month in SNAP benefits.[18] If the House Budget Committee block grant proposal had been in place in 2014 and was implemented via an across-the-board benefit cut, this family’s monthly benefits would have been cut by $112 per month, or about a third.
Benefit Cuts Would Increase Hunger and Poverty
SNAP cuts of the magnitude that the House Budget Committee proposes would almost certainly lead to increases in hunger and poverty. Emergency food providers report that more people ask for help in the latter part of the month, after their SNAP benefits run out. Under the plan’s steep funding cuts, a typical household’s SNAP benefits would run out many days earlier, placing greater strain on household finances (and on emergency food providers) and significantly increasing the risk of hunger.
Deep SNAP cuts also would cause more families and individuals to fall into poverty and push poor families deeper into poverty. SNAP lifted 10.3 million Americans above the poverty line in 2012, including 4.9 million children, and lifted 2.1 million children above half of the poverty line.[19]
The plan’s SNAP cuts would thus have a sharp, adverse effect on millions of the lowest-income Americans. Moreover, these cuts would not occur in isolation, as the House Budget Committee plan also contains steep cuts in other low-income assistance programs. Many vulnerable families would lose some or all of their health coverage, housing assistance, or other important supports such as child care, even while facing SNAP cuts.
Cuts Could Be Even Larger Under a Block Grant
Block-granting SNAP would eliminate its ability to respond automatically to the increased need that results from rising poverty and unemployment during economic downturns. Annual federal funding would remain fixed, regardless of whether the economy was in a recession or how severe an economic downturn was. As a result, the House Budget Committee staff’s estimate that the budget plan would cut SNAP by $125 billion over six years may understate the magnitude of the cut — the cuts would be still more severe if the economy performed less well over the coming decade than CBO projects.
If a SNAP block grant had been in effect in 2013 at funding levels set in 2007, before the recession, federal funding in 2013 would have been about 50 percent below actual funding that year (excluding the Recovery Act benefit boost).
Furthermore, under a block grant, SNAP would not expand automatically to respond to natural disasters. In 2015, SNAP helped households affected by wildfires in California, severe storms and flooding in South Carolina, and severe snowstorms in Massachusetts, as well as victims of disasters in several other states.
Also, under a block grant, some states facing large budget shortfalls would likely shift funds from food assistance to other purposes. SNAP includes several non-food components, such as job training and related child care; a block-grant structure would enable states to divert funds away from food to these purposes and withdraw state funds currently spent on those activities.
Finally, because of its capped funding structure, a block grant like the one the House Budget Committee proposes would reverse the recent progress made, on a bipartisan basis, to improve SNAP participation among eligible low-income households. Viewing SNAP as an important work support and health and nutrition benefit, the last three Administrations and governors from across the political spectrum have sought to boost participation rates — especially among working-poor families and low-income elderly people, the two groups with the lowest participation rates.
Overall, the efforts have paid off. SNAP reached 85 percent of eligible individuals in a typical month in 2013 (the most recent year available), a significant improvement from 2002, when the participation rate bottomed out at 54 percent. Participation among individuals in eligible low-income working families rose from 43 percent in 2002 to about 74 percent in 2013. For the elderly, it improved more modestly over that period — from 26 percent to about 41 percent. Block-granting SNAP would discourage states from seeking to maintain or extend these improvements, because the program would no longer be able to grow in response to an increase in the number of eligible people seeking assistance.
| TABLE 1 | |
|---|---|
| Illustrative State-by-State Impact of House Budget Committee’s SNAP Block-Grant Cuts | |
| State/Territory | Proportional Distribution of Cuts over Fiscal Years 2021-2026 (in millions of dollars) |
| Alabama | $2,100 |
| Alaska | $300 |
| Arizona | $2,300 |
| Arkansas | $1,000 |
| California | $12,000 |
| Colorado | $1,200 |
| Connecticut | $1,100 |
| Delaware | $400 |
| District of Columbia | $400 |
| Florida | $9,100 |
| Georgia | $4,500 |
| Guam | $200 |
| Hawaii | $800 |
| Idaho | $400 |
| Illinois | $5,300 |
| Indiana | $2,000 |
| Iowa | $800 |
| Kansas | $600 |
| Kentucky | $1,800 |
| Louisiana | $2,100 |
| Maine | $400 |
| Maryland | $1,800 |
| Massachusetts | $1,900 |
| Michigan | $3,800 |
| Minnesota | $1,000 |
| Mississippi | $1,500 |
| Missouri | $2,000 |
| Montana | $300 |
| Nebraska | $400 |
| Nevada | $1,000 |
| New Hampshire | $200 |
| New Jersey | $2,100 |
| New Mexico | $1,100 |
| New York | $8,000 |
| North Carolina | $3,800 |
| North Dakota | $100 |
| Ohio | $4,000 |
| Oklahoma | $1,400 |
| Oregon | $1,800 |
| Pennsylvania | $4,300 |
| Rhode Island | $500 |
| South Carolina | $1,900 |
| South Dakota | $200 |
| Tennessee | $3,000 |
| Texas | $8,400 |
| Utah | $500 |
| Vermont | $200 |
| Virgin Islands | $100 |
| Virginia | $2,000 |
| Washington | $2,400 |
| West Virginia | $800 |
| Wisconsin | $1,700 |
| Wyoming | $100 |
| Other SNAP spending | $14,000 |
| United States | $125,000 |
End Notes
[1] House Budget Committee staff described their assumed SNAP cuts verbally in response to a question from Rep. Gwen Moore during the mark-up of the proposed budget resolution on March 16, 2016. Also see House Budget Committee, A Balanced Budget for a Stronger America, Fiscal Year 2017 Budget Resolution, March 2016, pp. 32-37.
[2] According to House Budget Committee staff, the budget documents assume three policies in addition to the block grant: repealing broad-based categorical eligibility, eliminating state-option waivers from the three-month time limit for areas with high unemployment, and severing the link between SNAP and the Low Income Home Energy Assistance Program. The first two cuts were part of the SNAP bill the House passed in September 2013; the third was part of a budget reconciliation bill the House passed in 2012. For more information see Dottie Rosenbaum, Stacy Dean, and Robert Greenstein, “Cuts Contained in SNAP Bill Coming to House Floor Would Affect Millions of Low-income Americans,” revised September 17, 2013, https://www.cbpp.org/cms/index.cfm?fa=view&id=4009.
[3] See Ed Bolen et al., “More than 500,000 Adults Will Lose SNAP Benefits in 2016 as State Waivers Expire,” Center on Budget and Policy Priorities, January 21, 2016, https://www.cbpp.org/research/food-assistance/more-than-500000-adults-will-lose-snap-benefits-in-2016-as-waivers-expire.
[4] See Dorothy Rosenbaum and Brynne Keith-Jennings, “November 1 SNAP Cuts Will Affect Millions of Children, Seniors, and People With Disabilities,” Center on Budget and Policy Priorities, October 24, 2013, https://www.cbpp.org/files/10-24-13fa.pdf.
[5] See Dorothy Rosenbaum and Brynne Keith-Jennings, “SNAP Costs and Caseloads Declining; Trends Expected to Continue,” Center on Budget and Policy Priorities, March 8, 2016, https://www.cbpp.org/sites/default/files/atoms/files/11-20-13fa.pdf.
[6] All estimates use CBO’s January 2016 baseline assumptions for SNAP. For purposes of this analysis, we assume that SNAP benefits would be cut under the block grant by $111 billion over the period and that other activities in SNAP would bear a proportional share of the cuts. This is a conservative estimate; in the past, Congress has favored most of those other activities and not looked to them for large budget cuts. In addition, in past years during the Budget Committee mark-up, committee staff have indicated that under a block grant, states could cut benefits in order to fund other activities, such as job training. Thus, the cut to SNAP benefits could be deeper than this analysis assumes.
[7] Estimates are relative to CBO’s SNAP participation projections and assume that on average, the individuals who would be cut would otherwise have received the average benefit.
[8] This example assumes that the federal gross income limit would apply to all households. Currently the limit does not apply to households with elderly or disabled members or to households that are categorically eligible for SNAP because they receive another public assistance benefit, such as Temporary Assistance for Needy Families (TANF). In this scenario, about two-thirds of the households that would be cut would include elderly or disabled members. If a state wanted to shield such households from cuts, it would need to cut the gross income limit for other households to about 41 percent of the poverty level, or just $8,265 for a family of three in 2016 dollars.
[9] See USDA’s estimates of the monthly cost of the Thrifty Food Plan at http://www.cnpp.usda.gov/usdafoodcost-home.htm. To estimate an across-the-board cut, we reduced the maximum benefit relative to the Thrifty Food Plan by 23 percent beginning in 2021.
[10] Congressional Budget Office, “Options for Reducing the Deficit, 2015-2024,” November 2014, p. 10.
[11] House Budget Committee, A Balanced Budget for a Stronger America, Fiscal Year 2017 Budget Resolution, March, 2016, p. 36.
[12] Dorothy Rosenbaum and Brynne Keith-Jennings, “SNAP Costs and Caseloads Declining; Trends Expected to Continue,” Center on Budget and Policy Priorities, March 8, 2016, https://www.cbpp.org/sites/default/files/atoms/files/11-20-13fa.pdf.
[13] Dorothy Rosenbaum, “The Relationship Between SNAP and Work Among Low-Income Households,” Center on Budget and Policy Priorities, January 30, 2013, https://www.cbpp.org/cms/index.cfm?fa=view&id=3894.
[14] See Stacy Dean, “Balancing State Flexibility Without Weakening SNAP’s Success, Testimony Before the House Committee on Agriculture, U.S. House of Representatives,” Center on Budget and Policy Priorities, March 2, 2016, https://www.cbpp.org/food-assistance/balancing-state-flexibility-without-weakening-snaps-success.
[15] Under federal rules, a household’s monthly income must be at or below 130 percent of the poverty line — or roughly $2,177 a month (about $26,100 a year) for a family of three in 2016 — to qualify. There are some exceptions; for example, households with seniors and people with disabilities are not subject to the gross income test but must have net income (after deductions for certain necessary expenses) at or below the poverty line. States have some flexibility to lift the gross income test for certain other households. Also, some categories of people are not eligible for SNAP regardless of how low their income and assets are, such as most workers on strike, certain legal immigrants, many college students, and all undocumented immigrants. Unemployed childless adults may receive SNAP benefits for only three months out of every three years, except in areas with high unemployment — an exception that the budget would eliminate.
[16] The figure refers to working individuals and people in family units where one or more family members worked at some point during the year. It comes from CBPP analysis of Census Bureau Current Population Survey data.
[17] CBPP calculations based on Bureau of Labor Statistics usual weekly earnings data for wages at the 25th percentile adjusted for inflation using the CPI-U-RS.
[18] These figures are based on USDA household characteristics data. The benefit boost from the 2009 Recovery Act ended in November 2013; this increase has been removed from the figures cited here (for October 2013) to show what the typical working mother with two children would receive now.
[19] Based on CBPP analysis of the Supplemental Poverty Measure, adjusted for underreporting of benefits. See Arloc Sherman and Danilo Trisi, “Safety Net More Effective Against Poverty Than Previously Thought,” Center on Budget and Policy Priorities, May 6, 2015. https://www.cbpp.org/research/poverty-and-inequality/safety-net-more-effective-against-poverty-than-previously-thought.
More from the Authors

Areas of Expertise
