Who Are the Low-Income Childless Adults Facing the Loss of SNAP in 2016?
Some 500,000 to 1 million childless adults will be cut off SNAP (the Supplemental Nutrition Assistance Program, formerly the Food Stamp Program) over the course of 2016 as a three-month limit on benefits for unemployed childless adults returns in most areas of the country.[2] This paper addresses some basic questions about childless adults aged 18-49 without disabilities who may be subject to the time limit based on a review of research in the nearly 20 years since it was first imposed as part of the 1996 welfare law.
The research paints a picture of a diverse, struggling, and underserved group of poor Americans.While the research is surprisingly limited, especially since childless adults are the only demographic group subject to time limits on basic food assistance, it paints a picture of a diverse, struggling, and underserved group of poor Americans. While some experience long spells of deep poverty or chronic homelessness, many others cycle in and out of work, often in low-paying jobs that do not lift them out of poverty. The nation’s safety net offers meager assistance while they are working, and virtually none when they are out of work. SNAP benefits for this group average only about $150 to $170 per person per month, or about $5 a day.
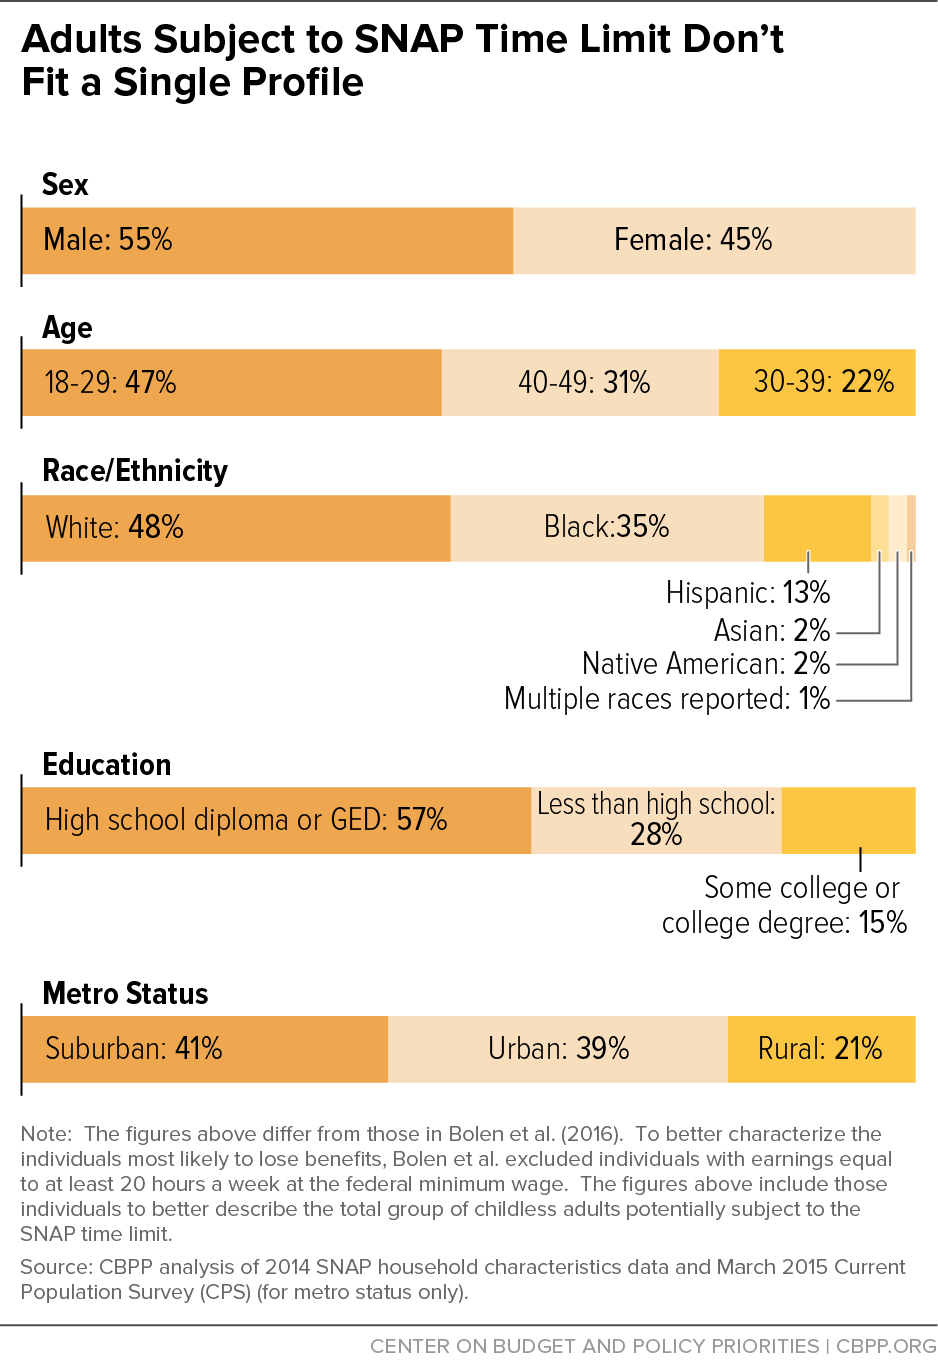
- Childless adults are demographically diverse, with multiple barriers to independence and self-sufficiency. There is no single profile. About 45 percent are women and close to one-third are over 40 years old. Among those who report their race, about half are white, a third are African American, and a tenth are Hispanic. About a quarter have less than a high school education, and more than half have only a high school diploma or GED. Some are veterans, and some are non-custodial parents. They live in all areas of the country ¾ less than 40 percent live in urban areas.[3]
- Most childless adults on SNAP who can work do so. At least a quarter of households with childless adults work while receiving SNAP, and about 75 percent work in the year before or the year after receiving SNAP. Among households that worked in a typical month while receiving SNAP or at some point during the following year, nearly half worked full time for at least six months. Many cycle through periods of work and unemployment, with little job security. Limited education, lack of training, and a sporadic work history make it difficult to compete for anything other than low-skill, low-wage jobs that do not lift them out of poverty.
- Childless adults on SNAP are extremely poor. Like many others, childless adults often turn to SNAP for assistance when they are no longer able to make ends meets, especially as jobs are lost, hours are cut, or wages hover at the federal minimum. While participating in SNAP, their income averages 29 percent of the poverty line, the equivalent of about $3,400 per year for a single person in 2016. (Average incomes are even lower — just 17 percent of poverty — for those not working 20 or more hours a week, who are most likely to be cut off due to the three-month limit.) Only 46 percent live in households with any income while receiving SNAP.
- Childless adults receive only limited government assistance. Many childless adults have disabilities that make working difficult or impossible but don’t meet the severe disability standard for receiving Supplemental Security Income (SSI) or Social Security Disability Insurance (SSDI). State General Assistance programs have weakened considerably. Few childless adults qualify for unemployment insurance, and childless adults are ineligible for Medicaid in 18 of the 19 states that haven’t adopted the Affordable Care Act’s Medicaid expansion. In addition, childless workers are the only demographic group that the federal tax system taxes into, or deeper into, poverty, in part because they are eligible only for a tiny Earned Income Tax Credit (EITC).[4] Federal income and payroll taxes pushed 1.2 million childless workers into poverty and another 5.8 million deeper into poverty in 2012.
- Childless adults who lose SNAP benefits continue to struggle. While many are employed after leaving SNAP, earnings are low and many remain poor. Many struggle to acquire enough food to meet their needs, lack health insurance, experience housing problems, and/or have trouble paying their bills.
Though childless adult SNAP recipients tend to have low education and skills and many experience chronic or episodic poverty, it’s important to note that the time limit applies to any childless adult who experiences a job loss, regardless of prior work history or income level. Most adults experience some period of time between ages 18 and 49 when they don’t have children in the home. If during this time they become unemployed and need help, they can qualify for only three months of food assistance from SNAP. While SNAP was designed to act as a safety net for people who are temporarily unemployed and to supplement the wages of low-income workers, the welfare law’s time limit weakens SNAP’s effectiveness as a safety net for unemployed childless adults.
Background
The nation’s largest anti-hunger program, SNAP provides nutritional support for low-wage working families, unemployed workers and their families, low-income seniors, and people with disabilities living on fixed incomes. After unemployment insurance, SNAP is the federal program most responsive to changing economic conditions, expanding to meet rising need during economic downturns and then contracting when conditions improve. In 2015, it helped 45.8 million low-income Americans in a typical month, down from its peak of 47.6 million in 2013.
Like most income support programs, SNAP primarily serves three vulnerable groups: low-income children and their parents and other household members (who make up close to 70 percent of SNAP participants), people with disabilities, and the elderly. But unlike other such programs, SNAP also serves a broad cross-section of those with little income and few resources to meet their basic needs, including working-age childless adults without severe disabilities.[5]
Three-Month Limit Isn’t True Work Requirement
One of the harshest provisions of the 1996 welfare law limits many childless adults to three months of SNAP benefits in any 36-month period when they aren’t employed at least half-time or in a qualifying work or training program. In setting this limit, the welfare law didn’t require states to offer work or job training to people who were unable to find a job on their own; nor did it provide funds to states for that purpose. And in reality, most states don’t offer these programs, in part because operating a work program that meets the requirements of the time-limit rules with enough slots for everyone at risk of hitting the three-month limit is too expensive.
SNAP recipients in a state that operates few or no employment programs for them and fails to offer them a spot in a work or training program — which is the case in most states — have their benefits cut off after three months even if they are searching diligently for a job or working less than 20 hours a week.
Because this provision denies basic food assistance to people who want to work and will accept any job or work program slot offered, it is effectively a severe time limit rather than a work requirement, as such requirements are commonly understood. Work requirements in public assistance programs typically require people to look for work and accept any job or employment program slot that’s offered. But they don’t cut off people who are willing to work and looking for a job simply because they can’t find one.
In fact, SNAP has separate work requirement authority much like this kind of work requirement, where states can require individuals to participate in job search or a training program but can’t terminate them if no program is available.
Until the mid-1990s, SNAP was the only federal public assistance program widely available to poor working-age adults with no children at home and no severe disability. Their access to basic food assistance largely ended with the 1996 welfare law, which limited adults aged 18-49 who are not physically or mentally unable to work, pregnant, or in a household with a minor child to three months of SNAP benefits in any 36-month period. Months of SNAP receipt don’t count toward the limit if the individual is working at least half-time, participating in a qualifying work activity for at least 20 hours a week, or participating in workfare. (See box above.)
The 1996 welfare law allows states to request a temporary waiver of the three-month limit in areas with persistently high unemployment. During and after the Great Recession of 2007-2009, nearly every state suspended the time limit due to soaring unemployment so poor jobless workers would have access to food while looking for work. Most of these waivers have expired and more than 40 states are imposing the time limit on childless adults in at least some areas. We estimate that because of states losing statewide waivers, 500,000 to 1 million people will be cut off SNAP over the course of 2016.
Most SNAP participants aren’t subject to the time limit because they are children, older adults and seniors, caring for a dependent, or unable to work. As a result, childless adults are a small, but highly vulnerable, segment of SNAP participants, accounting for 10 percent of all SNAP participants in fiscal year 2014.[6] (See box below.)
Who Is Subject to the Time Limit?
About 4.7 million non-elderly, non-disabled adults aged 18-49 in childless households participated in SNAP in fiscal year 2014. All were “subject” to the time limit in the sense that all could, in theory, have lost benefits after three months of participation. The number affected by the time limit in practice, however, is much smaller. Several factors explain this difference:
- Many non-elderly, non-disabled adults without children live in areas with temporary waivers of the time limit due to high unemployment or insufficient jobs. Months of participation while living in these areas don’t count against the time limit. As these waivers have expired in at least parts of most states, however, the clock has start again for many participants.
- Even with a time limit in place, some non-elderly, non-disabled adults without children may continue receiving SNAP because they work, or participate in a qualifying work or employment training program, at least 20 hours per week. Others may be pregnant, deemed unfit to work, or meet another exemption from the time limit.
- The welfare law allows states to exempt a limited number of those who would otherwise be ineligible for SNAP benefits because of the time limit (though most states historically have not made use of these exemptions).
Finally, some childless adults who participate in SNAP are in a period when the three-month clock is “ticking.” Existing data don’t permit us to identify those SNAP participants who run out the clock and lose benefits. Consequently, this paper largely describes the characteristics of the larger group of childless adults, all of whom would face the time limit if their circumstances or local labor market conditions change.
Childless Adults Are Demographically Diverse; Many Face Barriers to Employment
Low-income childless adults subject to the time limit are diverse; there is no single profile that dominates. About 45 percent are women and close to one-third are over age 40. Among those who report their race, about half are white, a third are African American, and a tenth are Hispanic. About a quarter have less than a high school education, and half have only a high school diploma or GED. They live in all areas of the country; among those for whom data on metropolitan status are available, about 40 percent live in urban areas, 40 percent in suburban areas, and 20 percent in rural areas.[7] Nearly 80 percent live in single-person households. Some are veterans.[8] (See Figure 1 and Appendix.)
Many low-income childless adults face multiple challenges to independence and self-sufficiency, including homelessness, physical and mental health limitations, language barriers, unstable employment histories, and criminal records. A detailed study of childless adults who were referred to a work experience program in Franklin County (Columbus), Ohio found that:[9]
- Many have extremely unstable living situations, evidenced by residence in short-term shelters or with friends and family and limited telephone service.
- One-third have a mental or physical limitation, including depression, post-traumatic stress disorder, mental or learning disabilities, or physical injuries. Some of these disabilities, though not severe enough to qualify for federal disability benefits, may still limit a person’s ability to work more than 20 hours a week.
- Nearly one-quarter are non-custodial parents, and 13 percent are caregivers for a parent, relative, or friend.
- More than 40 percent lack access to reliable private or public transportation; 60 percent lack a valid driver’s license.
- Fifteen percent need supportive services like language interpretation or help with transportation to obtain employment.
- Nearly one-quarter have been dismissed from a job in the past and others have gaps in their employment records — both of which can deter potential employers. More than one-third have felony convictions, making it hard to find jobs and pass background checks.
Physical and mental health issues can lead to job loss, complicate reentry into the workforce, and limit job opportunities that match abilities. Limited education, lack of training, and a sporadic work history often lead to low-skill, low-wage jobs that don’t lift workers out of poverty.
Most Are Extremely Poor
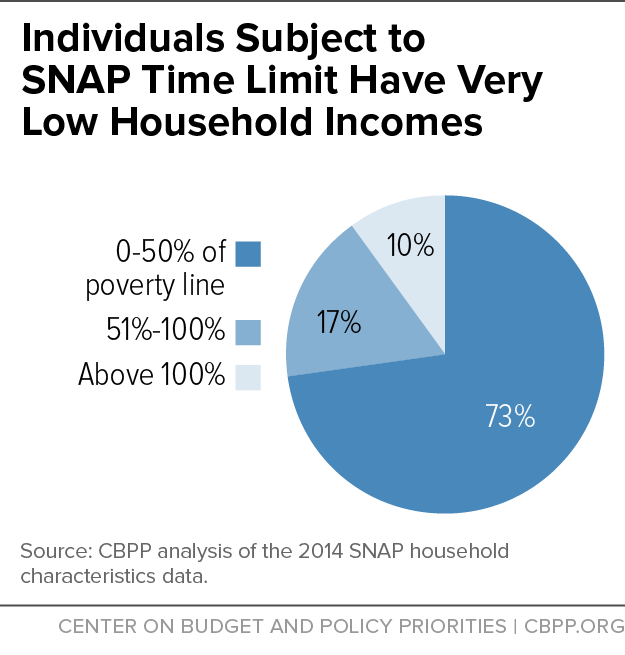
Childless adults on SNAP are extremely poor. Like many others, childless adults often turn to SNAP for assistance when they’re no longer able to make ends meet — for example, when they lose a job, have their hours cut, or can only find low-wage employment. While participating in SNAP, their income averages 29 percent of the poverty line, the equivalent of about $3,400 per year for a single person in 2016. (Average incomes are even lower — just 17 percent of poverty — for those not working 20 or more hours a week, who are most likely to be cut off due to the three-month limit.) Only 46 percent live in households with any income.[10] Almost three-quarters live in households with incomes below half of the poverty line and nearly all (90 percent) live in households below 100 percent of the poverty line (see Figure 2).
Earnings are the most common income source among childless adults. Over half of those with any income have earned income in a typical month while participating in SNAP; a little over 10 percent of those with any income receive General Assistance or Social Security. Even smaller shares receive Temporary Assistance for Needy Families (TANF) or SSI since childless adults generally don’t qualify for these programs, as detailed below (see Appendix).
Most Are Strongly Attached to Labor Force
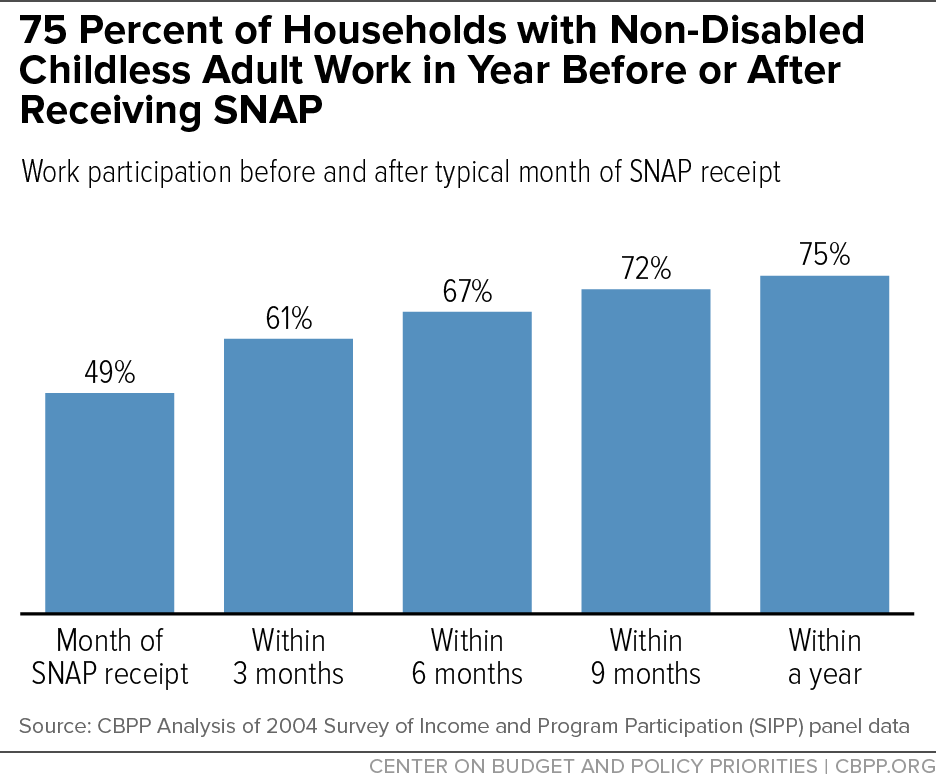
Most childless adults on SNAP who can work do so.[11] Because workers turn to SNAP during periods of unemployment, one should expect employment rates among childless adults while receiving SNAP to be relatively low. Still, in a typical month, at least a quarter and perhaps as many as half of all SNAP households with childless adults work.[12] Even more striking, about 75 percent of SNAP households with a childless, working-age adult worked in the year before or after receiving SNAP (see Figure 3).[13] And many of those not working while receiving SNAP were actively looking for work.[14]
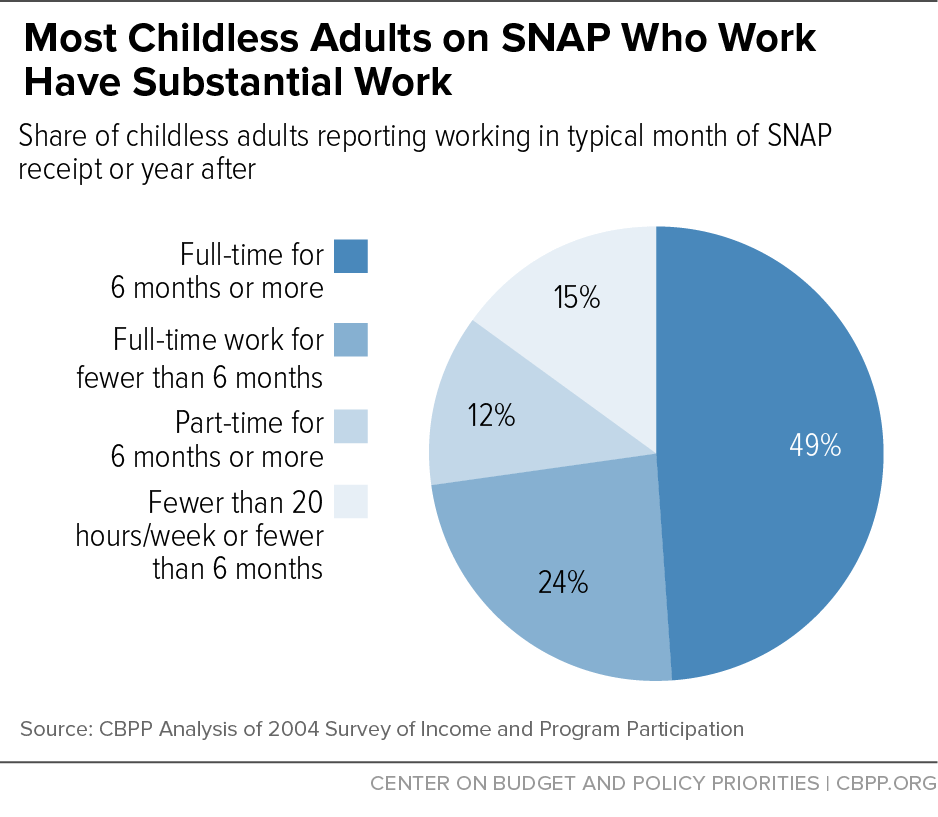
Most childless adults on SNAP who work have substantial work. Among SNAP households that worked in a typical month while receiving SNAP or worked at some point during the following year, nearly half (49 percent) worked full time (at least 35 hours a week) for six months or more of the following year. Twelve percent worked at least 20 hours per week for six or more months. Another 24 percent worked full time in at least one month over that period. Only about 15 percent worked 20 or more hours per week for less than six months or worked fewer hours than that.[15] (See Figure 4.)
Nonetheless, childless adults participating in SNAP are generally low-income, low-skill workers with limited job prospects. More than 80 percent have no more than a high school education or GED. They are more likely than other SNAP participants to lack basic job skills like reading, writing, and basic mathematics.[16] Caseworkers in a work experience program in Ohio found signs of functional illiteracy even among those with a high school degree.[17] As a result, wages of low-income childless adults are quite low: one study found that 90 percent of those aged 25-49 earned less than twice the minimum wage, compared to 47 percent of all workers aged 25-49.[18]
Significant Turnover Among Childless Adults Participating in SNAP
Many low-income childless adults receiving SNAP in any given month would soon leave the program even in the absence of time limits as personal circumstances and economic conditions change. A substantial body of research shows that, irrespective of the time limit, childless adults are less likely than other low-income people to start participating in SNAP, more likely to leave the program quickly, and less likely to return.
The most recent analysis, of data collected during the Great Recession and subsequent slow recovery, suggests:
- childless adults enter into SNAP at a rate about a third lower than the overall average for low-income people;
- they leave relatively quickly: half of childless adults leave SNAP within eight months, four months faster than the average participant; and
- childless adults who leave SNAP are less likely than others to return, and those who return do so only after much longer periods off the program.[19][20]
In part, this high turnover could reflect SNAP’s low benefit levels: most childless adults with more than minimal earnings are not poor enough to qualify for much in SNAP benefits. A single-person household working 30 hours a week at the federal minimum wage of $7.25 an hour without substantial shelter expenses qualifies for only the minimum SNAP benefit: $16 a month.[21] By contrast, a three-person household with a worker at the same wages and two children would qualify for more than $300 in SNAP benefits.
Little Support from Public Safety Net
Apart from SNAP, poor working-age adults without children at home qualify for limited assistance from public safety net programs. About 60 percent of low-income, non-disabled, working-age childless adults received help from any of five major safety net programs in 2013 (see Table 1).[22] The program serving the largest share was SNAP, which 43 percent received during a year in which most states still had broad waivers from the three-month time limit. When SNAP is excluded, only about a third receive assistance from any of the other major income support programs. The next most important source of support — the EITC — served only about a quarter of these individuals (and is received as a lump sum once a year, so not available to meet monthly expenses). No other program reached more than 7 percent.
| TABLE 1 | |
|---|---|
| Government Assistance for Low-income Childless Adults Is Limited | |
| Among individuals with no disability benefits in families with annual cash income below the federal poverty threshold in 2012 | Percent |
| Non-disabled adults aged 18-49 with no children in the home | 100% |
| Received no assistance from any of five major programs | 41 |
| Received assistance from at least one of five major programs | 59 |
| Received assistance from at least one of five major programs other than SNAP | 34 |
| Received assistance from: | |
| SNAP | 43 |
| Earned Income Tax Credit | 23 |
| Housing Assistance | 7 |
| Unemployment Insurance | 6 |
| Cash Welfare (Temporary Assistance for Needy Families or General Assistance) | 1 |
This lack of support reflects a variety of factors:
-
State General Assistance (GA) programs have weakened considerably. GA provides a safety net of last resort for people who are very poor and qualify for no other form of public assistance — generally cash assistance for those who don’t have minor children, aren’t disabled enough to qualify for (or don’t yet receive) SSI, and aren’t elderly. But GA has become a much weaker safety net over the years as many states eliminated or scaled back their programs. Only 26 states have a GA program that either operates statewide or is mandated and governed by statewide guidelines, and only 11 of the 26 states provide benefits to non-disabled childless adults.[23] Consequently, fewer than 5 percent of households with childless adults on SNAP received GA in 2014, down from nearly 15 percent in 1998.[24] Even for those receiving assistance, GA benefits are extremely modest: the maximum benefit is below half of the poverty level for an individual in every state but New Hampshire and below one-quarter of poverty in most.
-
Many childless adults have mental or physical limitations but don’t meet the strict standards for federal disability assistance. More than 30 million adults reported a disability in 2010, but only about half of those with severe disabilities and one in eight of those with less severe disabilities received SSI or SSDI.[25] Many health conditions that are severe enough to impair employment prospects aren’t severe enough to qualify for SSI or SSDI, which require applicants to show that their disability will last at least 12 months or result in death and makes it impossible to engage in any substantial work.[26]
About one in five childless adults who received SNAP in 2014 and didn’t have income from a disability program nonetheless reported either a disability that prevents or limits the type of work they can do or reported having serious difficulty with daily activities such as hearing, walking or climbing stairs, or concentrating and making decisions due to a physical, mental, or emotional condition.[27] Similarly, a third of the childless adults screened for a work experience program in Franklin County, Ohio had a physical or mental health limitation, but only one in five had filed for SSI or SSDI.[28]
-
Many low-income childless adults don’t qualify for unemployment insurance. The unemployment insurance (UI) system helps many people who lose their jobs by temporarily replacing part of their wages while they look for work. Temporary federal measures greatly expanded the reach of UI in the Great Recession, but those measures expired at the end of 2013. In addition, several states have cut back on the maximum number of weeks of regular state UI they offer. By December 2014, the share of unemployed workers receiving UI had fallen to a record low of just 27 percent.[29] Moreover, many low-income childless adults don’t qualify for or receive UI because they work part-time in high-turnover jobs that leave them with insufficient work histories or wages too low to meet minimum state requirements. For example, nearly 80 percent of SNAP childless adults screened for a work experience program in Franklin County, Ohio never received unemployment compensation.[30]
-
Millions of childless adults lack access to affordable health care. In 18 of the 19 states that haven’t adopted the Affordable Care Act’s Medicaid expansion, childless adults are ineligible for Medicaid no matter how low their incomes are. As a result, nearly 3 million low-income childless adults have limited options for health care coverage: they are ineligible for publicly financed coverage, most lack access to employer-based coverage, and all have limited income to buy coverage on their own.[31], [32]
-
Housing assistance reaches only a small share of eligible households. Overall, only one in four eligible households receive federal housing assistance due to limited funding.[33] For childless adults, the share of eligibles receiving federal rental assistance is only 12 percent.[34] Before the increase in homelessness in the last few decades, federal housing programs rarely permitted childless adults to receive assistance. While that policy has changed, lower participation by childless adults may be a legacy of that policy, as well as the restriction of many units of the appropriate size to people who are elderly or have disabilities. Few states provide any housing assistance, and those that do assist small numbers of households, often targeting people who are elderly or have disabilities.
-
Federal taxes push millions of childless workers into poverty. In 2012, federal income and payroll taxes pushed 1.2 million childless workers into poverty and another 5.8 million deeper into poverty.[35] The EITC reduces taxes and provides an important work incentive for low- and moderate-income families with children, but for childless adults it offsets only a very small share of their income and payroll taxes; in 2012, the average credit for eligible workers aged 25-64 was only about $270, or less than one-tenth the average $2,900 EITC for tax filers with children. As a result, while the EITC lifts well over 10 percent of poor families with children out of poverty, it does so for only 1 percent of poor families without children.[36]
In the absence of public assistance, charitable food assistance is often the only source of support for childless adults. Feeding America, the nation’s largest charitable hunger-relief organization, estimates that its network of providers served meals to about 1 million people aged 18-49 in a typical month in 2014; roughly another 3 million adults aged 18-49 received groceries and other household supplies for home use. [37] More direct evidence comes from childless adults in Franklin County, Ohio who left SNAP due to time limits: at least 80 percent of respondents acquired food from a pantry, soup kitchen, or homeless shelter after leaving SNAP.[38]
Many Face Hardships After Losing SNAP
What happens to childless adults once they leave SNAP? The most comprehensive assessment of former SNAP recipients in four states in the early 2000s suggests that their life circumstances are quite difficult. [39] A significant minority don’t find work, and among those who are employed after leaving SNAP, earnings are low. Most remain poor. Many struggle to acquire enough food to meet their needs, lack health insurance, experience housing problems, and/or have trouble paying their bills. (These studies include people who leave SNAP because of the three-month time limit or for other reasons, for example, because they found a job or mistakenly believe they are no longer eligible.)
-
Many who lost SNAP benefits were employed but had low earnings. Between 41 and 76 percent of the former recipients in the four states were working after leaving SNAP. They worked more than 35 hours per week, on average, and earned between $350 and $1,000 per month. Most of those who were not working in Arizona and Illinois were in poor health or caring for a family member in poor health. Given the complexity of SNAP’s rules governing work effort, disability, and time limits, some may not realize that they may again qualify for SNAP and fail to reapply for benefits.
-
Many were still poor. Despite relatively high levels of work effort, between one-third and roughly two-thirds of SNAP leavers in the four states had household incomes below the poverty line — well above the overall poverty rate of 13 percent. Many of these households experienced severe poverty after leaving SNAP: about 40 percent of the leavers in two states were below half of the poverty line.
-
Many struggled to acquire adequate food. Between 17 and 34 percent of the SNAP leavers in the four states reported very low food security (meaning they had to skip or reduce the size of their meals or otherwise disrupt their eating patterns at times during the year because they couldn’t afford enough food), compared with 3 percent of all households without children.[40]
-
Many lacked health insurance, had housing problems, or had trouble paying their utility bills. About 30 to 40 percent of the SNAP leavers in the four states faced housing issues, including falling behind on the rent, moving in with relatives, or becoming homeless. Between 20 and 65 percent reported problems paying for utilities. Just over half of the SNAP leavers in two of the states were uninsured.[41]
Conclusion
America’s low-income childless adults, who generally have limited education and skills and limited employment prospects even in normal economic times, aren’t well served by the nation’s public assistance safety net. While most who can work do so, most remain extremely poor with few sources of income and struggle to meet their basic needs. SNAP is one of the few forms of support available to them, so the reimposition of the three-month limit on SNAP benefits will cause serious hardship for many.
| APPENDIX TABLE 1 | |||||
|---|---|---|---|---|---|
| Characteristics of Adult SNAP Participants (Average monthly) | |||||
| All Adult SNAP Participants (Age 18 & Older) |
Non-Disabled Adult SNAP Participants in Households Without Children | ||||
| Number (in millions) |
Share | Number (in millions) |
Share | ||
| Total | 25.6 | 100% | 4.7 | 100% | |
| Sex: | |||||
| Male | 9.7 | 38% | 2.6 | 55% | |
| Female | 15.9 | 62% | 2.1 | 45% | |
| Age: | |||||
| 18-29 | 7.0 | 27% | 2.2 | 47% | |
| 30-39 | 5.4 | 21% | 1.1 | 22% | |
| 40-49 | 4.3 | 17% | 1.5 | 31% | |
| 50-59 | 4.3 | 17% | - | - | |
| 60-69 | 2.5 | 10% | - | - | |
| 70+ | 2.1 | 8% | - | - | |
| Race/Ethnicity:* | |||||
| White, not Hispanic | 11.1 | 50% | 2.0 | 48% | |
| Black or African American, not Hispanic | 6.6 | 30% | 1.5 | 35% | |
| Hispanic, Any Race | 3.2 | 15% | 0.5 | 13% | |
| Asian, not Hispanic | 0.7 | 3% | 0.1 | 2% | |
| Native American, not Hispanic | 0.3 | 1% | 0.1 | 2% | |
| Multiple Races Reported, not Hispanic | 0.2 | 1% | ** | 1% | |
| White, not Hispanic | 11.1 | 50% | 2.0 | 48% | |
| Race Unknown | 3.5 | - | 0.5 | - | |
| Education:* | |||||
| Less than high school | 7.0 | 30% | 1.2 | 28% | |
| High school diploma or GED | 12.6 | 54% | 2.4 | 57% | |
| Some college or college degree | 3.9 | 16% | 0.7 | 15% | |
| Education Unknown | 2.2 | - | 0.4 | - | |
| Individuals with Income From: | |||||
| Earnings | 6.2 | 24% | 1.1 | 24% | |
| More than 20 hours a week*** | 5.1 | 20% | 0.6 | 14% | |
| Less than 20 hours a week | 1.1 | 4% | 0.5 | 11% | |
| TANF | 1.2 | 5% | 0.5 | 1% | |
| Social Security | 5.9 | 23% | ** | 1% | |
| Supplemental Security Income | 4.7 | 18% | - | - | |
| Unemployment insurance | 0.5 | 2% | 0.1 | 3% | |
| Other governmental assistance, including General Assistance | 0.9 | 3% | 0.2 | 4% | |
| Contributions and charity | 0.5 | 2% | 0.1 | 2% | |
| Child support and other non-governmental assistance | 2.3 | 9% | 0.9 | 2% | |
| No individual income, but other household members have income | 3.6 | 14% | 0.5 | 11% | |
| Individuals with Household Gross Income as a Percentage of Poverty: | |||||
| Zero | 5.2 | 20% | 2.5 | 54% | |
| 1 to 50% | 5.2 | 20% | 0.9 | 20% | |
| 51 to 100% | 10.4 | 41% | 0.8 | 16% | |
| More than 100% | 4.8 | 19% | 0.5 | 10% | |
| Labor Force Status: | |||||
| Not in labor force | 13.4 | 52% | 1.4 | 29% | |
| Unemployed and looking for work | 5.9 | 23% | 2.2 | 46% | |
| Employed | 6.4 | 25% | 1.2 | 25% | |
| Average SNAP benefit per person | $125 | $163 | |||
End Notes
[1] Steven Carlson is a research analyst who previously directed the Office of Policy Support at the Agriculture Department’s Food and Nutrition Service. The opinions and conclusions expressed in this report are solely those of the authors and should not be construed as representing the views of the Agriculture Department.
[2] For more information on time limits and the impact of expiring waivers, see Ed Bolen et al., “More than 500,000 Adults Will Lose SNAP Benefits in 2016 as Waivers Expire,” Center on Budget and Policy Priorities, updated January 21, 2016, https://www.cbpp.org/research/food-assistance/more-than-500000-adults-will-lose-snap-benefits-in-2016-as-waivers-expire.
[3] Some of the statistics presented in this paper differ from those in Bolen et al. To better characterize the individuals most likely to lose benefits, Bolen et al. excluded individuals with earnings equal to or greater than 20 hours a week at the federal minimum wage. This paper, in contrast, includes those individuals to better describe the total group of childless adults on SNAP who are potentially subject to the time limit.
[4] See Chuck Marr et al., “Lone Group Taxed Into Poverty Should Receive a Larger EITC,” Center on Budget and Policy Priorities, April 14, 2014, https://www.cbpp.org/research/lone-group-taxed-into-poverty-should-receive-a-larger-eitc.
[5] In the context of SNAP, these individuals are known as able-bodied adults without dependents (ABAWDs). This paper uses the phrase “childless adults” to acknowledge the variety of definitions adopted in the research literature to identify this at-risk group of non-elderly, non-disabled adults without children.
[6] While still small as a share of the total SNAP caseload, this percentage is high by historical standards due to the recession. Although differences in estimation methods make precise comparisons over time difficult, childless adults made up only about 5 percent of SNAP recipients before the onset of the Great Recession, when soaring unemployment, falling incomes, and growing poverty expanded the need for SNAP assistance. In addition, because of high unemployment and reduced job opportunities, most states received temporary statewide waivers from the time limit during the Great Recession and its aftermath, enabling them to provide childless adults in most areas with access to food while they looked for work. Most recently, the number of childless adults on SNAP has started falling as economic conditions slowly improve and statewide waivers expire.
[7] The statistic on metropolitan status is based on CBPP calculations of March 2015 Current Population Survey (CPS) data for adults aged 18-49, with no children in the household, who are not receiving disability benefits and who do not report working more than 20 hours a week; both the source and the definition are different from the other statistics cited.
[8] CBPP estimates that as many as 100,000 childless adults who receive SNAP are veterans. CBPP analysis of March 2015 Current Population Survey (CPS). (Because this figure includes those who work at least 20 hours a week, it differs from CBPP’s previous estimate of how many veterans are likely to be at risk of losing benefits in 2016 due to the time limit.)
[9] See “Comprehensive Report on Able-Bodied Adults Without Dependents, Franklin County Ohio Work Experience Program,” Ohio Association of Foodbanks, 2015, http://admin.ohiofoodbanks.org/uploads/news/ABAWD_Report_2014-2015-v3.pdf. The Ohio Association of Foodbanks gathered the information for the report as a result of a partnership with the county SNAP agency to help place individuals identified as subject to the time limit in qualifying work activities after screening them.
[10] These figures are for a typical month while childless adults are receiving SNAP. As discussed below, many childless adults cycle in and out of jobs and have more income over the year.
[11] Although the research evidence is sparse, the evidence that does exist suggests that SNAP participation doesn’t discourage childless adults from working when jobs are available. See, for example, Joel Cuffey, Elton Mykerezi, and Timothy Beatty, “Food Assistance and Labor Force Outcomes of Childless Adults: Evidence from the CPS,” paper presented at the 2015 Agricultural & Applied Economics Association and Western Agricultural Economics Association Annual Meeting, July 2015, http://ageconsearch.umn.edu/bitstream/205821/1/Mykerezi_Beatty_Cuffey_ABAWDWorkIncentives_r.pdf.
[12] This range reflects a difference in data sources. USDA’s administrative data show that 27 percent of all SNAP households with non-disabled childless adults worked in a typical month of 2014 (see Food and Nutrition Service, Table A.16). Unpublished tabulations generated by CBPP from the Census Bureau’s 2004 Panel of the Survey of Income and Program Participation (SIPP) show employment rates for SNAP households with non-disabled childless adults as high as 50 percent in a typical month between 2004 and 2007. USDA’s administrative data may be lower for several reasons. First, SIPP is a household survey, which means that respondents must have a fixed residence; SNAP reaches many homeless households and other more transient households who may be less likely to be employed while receiving SNAP. Second, work that households aren’t required to report for SNAP purposes may be captured by the SIPP data but not the SNAP data. (Some work may not be required to be reported for SNAP, either because it is irregular or not expected to continue, or because, under SNAP’s “simplified reporting” rules, changes in circumstances need only be reported at six-month intervals unless they raise household income above 130 percent of the poverty level.)
[13] For a more general discussion of the labor force attachment of SNAP participants and the methods underlying this analysis, see Dorothy Rosenbaum, “The Relationship Between SNAP and Work Among Low-Income Households,” Center on Budget and Policy Priorities,” January 2013, www.cbpp.org/sites/default/files/atoms/files/1-29-13fa.pdf. The analysis covers the 2004-2007 period, before the recession. A preliminary analysis of the 2008 SIPP data covering May 2008 to July 2010 indicates that SNAP households continued to have a strong attachment to the labor force during the recession.
[14] USDA’s administrative data suggest that, in a typical month in 2014, more than half (61 percent) of all childless adults on SNAP who were not working were looking for work. Although this statistic should be viewed with caution as the data may not be sufficiently reliable to draw firm conclusions, it’s noteworthy that Urban Institute researchers, using National Survey of American Families data, found that three-quarters of all low-income, able-bodied adults without dependents (not just those on SNAP) worked in 1997 and 86 percent were in the labor force (that is, either working or actively looking for work). See Stephen Bell and Jerome Gallagher, “Prime-Age Adults without Children or Disabilities: The ‘Least Deserving of the Poor’—or Are They? Assessing the New Federalism Policy,” Urban Institute, February 2001, http://www.taxpolicycenter.org/publications/url.cfm?ID=310269.
[15] Because it is more intuitive to think about the amount of work over a one-year period, we present findings on work effort in the year following a month of SNAP receipt, rather than looking at a two-year period consisting of the year before and the year after a month of SNAP. The findings about work effort in the year prior are similar — nearly half of households with a non-disabled adult aged 18-59 that worked in the year before a month of SNAP receipt worked full-time for at least six months.
[16] “Food Stamp Employment and Training Program,” United States General Accounting Office (GAO—3-388), March 2003, p. 17, http://www.gao.gov/assets/240/237571.pdf.
[17] See “A Comprehensive Assessment of Able-Bodied Adults Without Dependents and Their Participation in the Work Experience Program in Franklin County, Ohio,” Ohio Association of Foodbanks, 2014, http://admin.ohiofoodbanks.org/uploads/news/WEP-2013-2014-report.pdf.
[18] See Bell and Gallagher (2001).
[19] For the most recent analysis of SNAP entries and exits, which uses data for 2008-2012, when childless adults in almost every state lived in areas where the time limit was waived, see Joshua Leftin et al., “Dynamics of Supplemental Nutrition Assistance Program Participation from 2008 to 2012,” prepared for the Food and Nutrition Service, USDA, December 2014, http://www.fns.usda.gov/sites/default/files/ops/Dynamics2008-2012.pdf.
[20] A recent study of SNAP households with zero income while participating in SNAP confirms that such individuals have fluid circumstances. Among such households, the median duration of zero-income status was three months. The study also found that earnings were the most common type of income when these households had income. In-depth interviews with such individuals, many of whom were childless adults aged 18-49, revealed that many faced significant work barriers, such as low literacy, work-related injuries, or a criminal record, and cycled in and out of jobs. See USDA, “The Characteristics and Circumstances of Zero-Income Supplemental Nutrition Assistance Program Households,” October 7, 2014, http://www.fns.usda.gov/characteristics-and-circumstances-zero-income-supplemental-nutrition-assistance-program-households.
[21] Thirty hours a week at the federal minimum wage comes to just under the federal poverty level for a household of one.
[22] We excluded Medicaid from this analysis because of data quality concerns and because it covers a time period before the Affordable Care Act’s Medicaid expansion took effect. Childless adults with income below 138 percent poverty now qualify for Medicaid in the 32 states that so far have adopted the expansion.
[23] Liz Schott and Misha Hill, “State General Assistance Programs Are Weakening Despite Increased Need,” Center on Budget and Policy Priorities,” July 9, 2015, https://www.cbpp.org/research/family-income-support/state-general-assistance-programs-are-weakening-despite-increased.
[24] See Table II.5 in Stavrianos and Nixon (1998) and Table A.16 in Characteristics of Supplemental Nutrition Assistance Program Households: Fiscal Year 2014.
[25] Matthew W. Brault, “Americans with Disabilities: 2010,” U.S. Census Bureau, Current Population Reports, P70-131, 2012, http://www.census.gov/prod/2012pubs/p70-131.pdf, Table A-3. This table is for adults aged 15-64, a group slightly larger than the group subject to the SNAP time limit.
[26] SSI provides monthly cash assistance to people with severe disabilities, little income, and few assets. SSDI applicants, in addition to meeting SSI’s strict medical criteria, must have worked long enough and recently enough in jobs covered by Social Security. For more information see: “Policy Basics: Introduction to Supplemental Security Income,” Center on Budget and Policy Priorities, December 2, 2015, https://www.cbpp.org/research/social-security/policy-basics-introduction-to-supplemental-security-income and Kathy Ruffing, “It’s Hard to Qualify for Disability Insurance,” Center on Budget and Policy Priorities, August 7, 2015, https://www.cbpp.org/blog/its-hard-to-qualify-for-disability-insurance.
[27] CBPP analysis of March 2015 Current Population Survey (CPS) data for adults aged 18-49, with no children in the household, who aren’t receiving disability benefits; 14 percent reported a disability that prevents or seriously limits work and another 6 percent reported a serious physical, mental, or emotional impairment.
[28] Ohio Association of Foodbanks (2015), p. 10.
[29] Claire McKenna, “The Job Ahead: Advancing Opportunity for Unemployed Workers,” National Employment Law Project, February 2015, http://nelp.org/content/uploads/2015/03/Report-The-Job-Ahead-Advancing-Opportunity-Unemployed-Workers.pdf. The share of the unemployed receiving UI has not increased significantly since 2014.
[30] Ohio Association of Foodbanks (2015), p. 15.
[31] Rachel Garfield et al., “The Coverage Gap: Uninsured Poor Adults in States that Do Not Expand Medicaid – An Update,” Kaiser Commission on Medicaid and the Uninsured, January 2016, http://kff.org/health-reform/issue-brief/the-coverage-gap-uninsured-poor-adults-in-states-that-do-not-expand-medicaid-an-update/.
[32] For information on health insurance coverage and other related characteristics of childless adults prior to health reform, see Lisa Dubay et al., “How Will the Uninsured be Affected by Health Reform? Childless Adults,” The Urban Institute, August 2009, http://research.urban.org/uploadedpdf/411950_uninsured_childless.pdf.
[33] Center on Budget and Policy Priorities, “Policy Basics: Federal Rental Assistance,” updated December 21, 2015, https://www.cbpp.org/research/housing/policy-basics-federal-rental-assistance.
[34] Barbara Sard and Will Fischer, “Chartbook: Federal Housing Spending is Poorly Matched to Need,” Center on Budget and Policy Priorities, December 18, 2013, https://www.cbpp.org/research/chart-book-federal-housing-spending-is-poorly-matched-to-need#Six.
[35] Chuck Marr et al., “Lone Group Taxed Into Poverty Should Receive a Larger EITC,” Center on Budget and Policy Priorities, April 14, 2014, https://www.cbpp.org/research/lone-group-taxed-into-poverty-should-receive-a-larger-eitc.
[36] Christine Scott and Margot L. Crandall-Hollick, “The Earned Income Tax Credit (EITC): An Overview,” Congressional Research Service, April 2014, https://www.hsdl.org/?view&did=752265. This analysis categorizes families by the number of children under 18 in the extended family, which may differ from the number of children that qualify for the EITC. The CRS analysis also relies on a poverty measure that differs slightly from the Census Bureau’s Supplemental Poverty Measure used for CBPP’s analysis.
[37] Nancy S. Weinfield et al., “Hunger in America 2014 National Report,” prepared for Feeding America, August 2014, Tables 4-2, 4-3, and 4-4, http://www.feedingamerica.org/hunger-in-america/our-research/hunger-in-america/. Estimates are based on Feeding America’s findings that its network served 1.5 million people aged 18-49 in a typical month, of whom two-thirds were in households that included neither children nor seniors, and 80 percent of those consisted of a single person living alone; and that 16.2 million adults aged 18-49 received groceries and other household supplies for home use, of whom about one-third were in households with neither children nor seniors, and nearly half of these consisted of a single person living alone.
[38] Ohio Association of Foodbanks (2014), page 26.
[39] Elizabeth M. Dagata, “Assessing the Self-Sufficiency of Food Stamp Leavers,” Economic Research Service, USDA, September 2002, , https://www.ers.usda.gov/publications/pub-details/?pubid=46645, a summary of in-depth studies in Arizona, Illinois, Iowa, and South Carolina.
[40] At the time of the leaver surveys, USDA’s most severe level of food insecurity was “food insecurity with hunger.” In 2006, USDA introduced new language to describe ranges of severity of food insecurity, in response to recommendations by an expert panel convened at USDA’s request by the Committee on National Statistics of the National Academies. The methods used to assess households’ food security remained unchanged, however, so statistics for 2005 and later years are directly comparable with those for earlier years.
[41] As discussed elsewhere, in the states that have expanded Medicaid under the ACA, childless adults now qualify for health coverage.
More from the Authors

Steven Carlson is a research analyst who previously directed the Office of Policy Support at the Agriculture Department’s Food and Nutrition Service.

Areas of Expertise
