Child Poverty Falls to Record Low, Comprehensive Measure Shows Stronger Government Policies Account for Long-Term Improvement
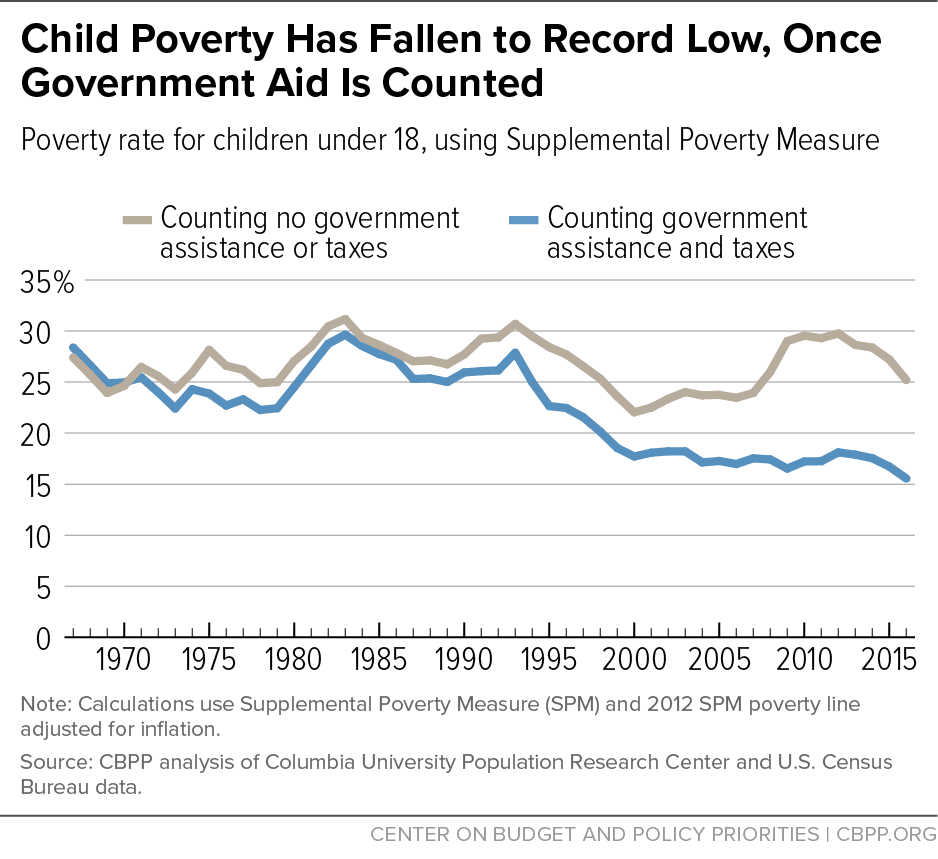
The child poverty rate fell to a record low of 15.6 percent in 2016, a little more than half its 1967 level of 28.4 percent. This finding emerges from a new poverty series we have developed that combines the Census Bureau’s poverty data for 2016 with long-term poverty data compiled by Columbia University researchers. The new poverty series relies on the federal government’s Supplemental Poverty Measure (SPM), a comprehensive yardstick that most analysts believe provides a more accurate assessment of the resources available to low-income households to meet basic needs than the “official” poverty measure does. That’s because the SPM counts the income that the Supplemental Nutrition Assistance Program (SNAP, formerly known as the Food Stamp Program), rental subsidies, and other federal non-cash benefits and refundable tax credits provide, while the “official” poverty measure ignores such benefits.
The robust progress against child poverty is largely an unheralded development.The robust progress against child poverty is largely an unheralded development. So is the role of government programs in driving this progress.
The data show that the near-halving of the child poverty rate since the late 1960s is largely attributable to the creation or expansion of various safety net programs, particularly SNAP and two major refundable tax credits. When poverty is measured without counting the income that safety net programs provide (i.e., under the official poverty measure), child poverty has fallen significantly the last two years as the labor market tightened, but is only modestly lower than it was in the 1960s. But once these benefits are taken into account, a large decline in child poverty is evident. (See Figure 1.)
Using the SPM is especially important in examining long-term poverty trends. In the years since the 1960s, policymakers created and then expanded the Earned Income Tax Credit (EITC) and the Child Tax Credit (CTC); these refundable tax credits provide substantial income support to low-income working families with children. And SNAP barely existed in 1967, the first year in our data series, while today it’s a major program serving over 40 million people.
Nevertheless, child poverty remains too high; roughly 1 in 7 American children are poor. Child poverty remains more prevalent in the United States than in most other western nations, and much of the disparity reflects the fact that despite the expansion of U.S. programs to combat child poverty, government support for children remains substantially weaker here than in most other western countries.
Further progress against child poverty should thus be a priority, especially since the long-lasting consequences of child poverty are becoming increasingly evident. A growing body of research finds that government aid to poor children not only helps to address their basic needs today, but also can improve their health, educational outcomes, and earnings in adulthood — making such assistance an investment in their future prospects.
The Decline in Child Poverty Over Time
The SPM[1] that we use relies on a historical series, known as the “anchored SPM,” produced by a Columbia University research team.[2] A major advantage of the Columbia data is that the Census Bureau’s SPM goes back only to 2009, while the Columbia series[3] extends back to 1967. We use the Census data starting in 2009, and the Columbia data for prior years.
Before taking government benefits and tax policies into account,[4] child poverty has improved only modestly over the past five decades; it declined from 27.4 percent in 1967 to 25.1 percent in 2016. (See Table 1.) This suggests that labor market trends and developments in the private economy have not, on balance, led to a large reduction in child poverty over this period.
The lack of progress under this measure reflects the net effect of a number of cross-cutting economic and demographic trends. Some trends have pushed the poverty rate downward, including increased education levels among adults, fewer children per family, and rising employment among women. But other trends have pushed in the opposite direction, including rising income inequality, stagnant wages for much of the workforce, and increases in single-parent families. These two sets of trends have mostly offset each other.
This is not to suggest that labor market trends don’t matter: as one example, child poverty measured before taking government benefits into account dropped significantly from 2014 to 2016 as the labor market tightened and broad earnings growth ensued.[5] The booming economy of the late 1990s had a similar effect. But the underlying factors that have led to economic growth over recent decades have translated into little progress in reducing poverty before government benefits are considered, in part because so much of the gains from economic growth have gone to those on the upper rungs of the economic ladder.
Once government benefits and tax credits are taken into account, child poverty trends over the past 50 years are decidedly brighter. As noted, child poverty has been cut nearly in half from 1967 to 2016 — from 28.4 percent to 15.6 percent. Some 9.5 million fewer children are poor today than would be if the poverty rate had remained unchanged.
Moreover, this improvement in child poverty has benefited all demographic groups. Data broken out by racial-ethnic group that go back to 1991 demonstrate that, from that year to 2016, SPM poverty rates among black, Hispanic, and non-Hispanic white children were all cut roughly in half[6] (though poverty rates remained much higher in every year among children of color than among non-Hispanic white children).
| TABLE 1 | ||
|---|---|---|
| Child Poverty Rates Have Fallen Largely Due to Government Programs | ||
| Counting No Government Aid or Taxes | Counting Government Aid and Taxes | |
| 1967 | 27.4% | 28.4% |
| 2016 | 25.1% | 15.6% |
| Percentage-point decline | -2.3% | -12.8% |
As Table 1 indicates, child poverty was actually modestly higher in 1967 after taking government benefits and taxes into account than before, because at that time, a significant number of families with children were taxed into poverty.
Since then, however, the EITC and the CTC were established and expanded, and today these tax credits lift nearly 5 million children out of poverty. Similarly, nationwide implementation of SNAP in the early 1970s and its increased effectiveness over time in reaching more of the eligible population (especially working-poor families) have lifted millions of additional children out of poverty.[7]
In 2016, in fact, government policies lifted above the poverty line 38 percent of the children who would otherwise be poor (see Figure 2), with the refundable tax credits and SNAP accounting for the majority of this strong anti-poverty effect. Programs such as housing assistance and Supplemental Security Income, which helps families care for children with severe disabilities, also had significant poverty-reducing effects. (In addition to reducing the number of children living in poverty by lifting many above the poverty line, all of these programs also substantially reduce the severity of poverty by lifting millions more who remain poor closer to the poverty line.)
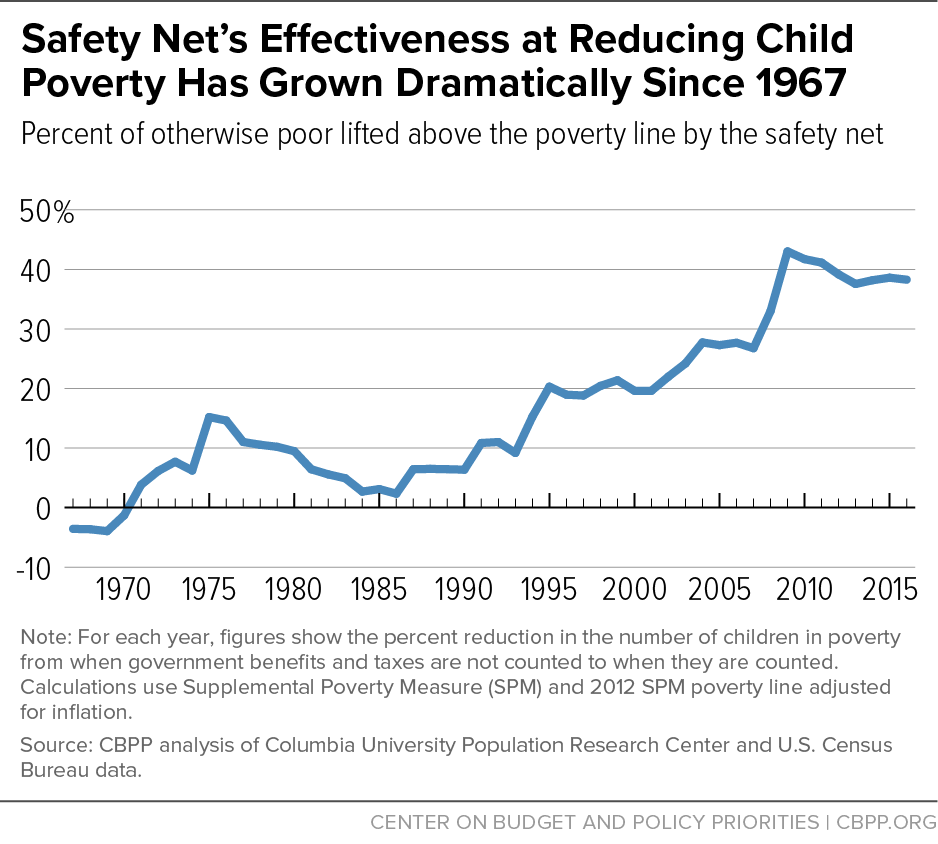
Striking as these figures are, they understate safety net programs’ impact in reducing poverty because the Census data on which they’re based miss a significant share of the program benefits that low-income families and individuals receive. Household surveys depend on participants’ recollections over many months and typically fail to capture some government assistance income, and while it’s possible to adjust the data to correct for this underreporting, 2014 is the latest year for which we can do so. In that year, before correcting for the underreporting of benefits, safety net programs reduced the number of children who were poor by 38 percent. After correcting for underreporting, the safety net reduced the number of poor children by 50 percent, meaning that safety net programs lifted out of poverty half of the children who would otherwise have been poor.[8] Once the information needed to correct for underreporting (which the Urban Institute produces) becomes available for 2016, the share of children in poverty last year likely will drop below the 15.6 percent level noted here, by two percentage points or more.
Some safety net critics may argue that government programs have led to higher “market” poverty rates — that is, to higher poverty rates before taking government benefits and taxes into account because they create disincentives for people to work. We previously analyzed this claim in depth and found it seriously flawed.[9] The EITC and CTC significantly increase work incentives for poor people; for most working-poor families, these credits either grow with each additional dollar earned or remain unchanged, and research finds they cause more people — not fewer — to work. Moreover, a comprehensive review of the research literature on the effects of safety net programs on work found that behavioral responses due to government benefits are modest, and on balance, have little impact on the degree to which the safety net lifts people out of poverty.[10]
Government Programs Have Also Driven Record Health Insurance Coverage for Children
This progress on child poverty has been accompanied by striking progress in children’s health coverage: in each of the past two years, roughly 95 percent of all U.S. children have had health insurance, the highest percentage ever recorded. This compares to 86 percent of children having coverage in 1997, and likely significantly lower coverage in the decades prior to that (a consistent time series before 1997 is not available). The coverage gains reflect expansions of Medicaid over recent decades, creation of the Children’s Health Insurance Program in 1997, and the Affordable Care Act’s coverage expansions.
In short, child poverty is now at an all-time low while children’s health coverage is at an all-time high. The progress on both fronts over recent decades is attributable to stronger government programs.
More Needs to Be Done
The progress in improving low-income children’s living standards should not obscure the real problems that remain, including the uneven distribution of family earnings and income gains the economy has generated in recent decades. The SPM indicates that 1 in every 7 children — or 11 million — still are poor (though an adjustment for benefit underreporting would make this number closer to 1 in 8).
Further, our nation continues to lag well behind most other western industrialized nations in addressing child poverty, in substantial part because safety net assistance is considerably weaker here. A recent cross-country comparison found the U.S. child poverty rate to be significantly higher than the rate in all other 15 countries examined, including countries like Canada, Germany, and the United Kingdom.[11] It also found that the U.S. safety net lifted a smaller share of otherwise-poor children out of poverty than the safety nets of all of these 15 other countries.
Additional progress in reducing child poverty is important not only to alleviate immediate hardship, but also to advance children’s future economic prospects. A recent comprehensive assessment by CBPP analysts of the research literature on the relationship between government income support and children’s long-term prospects found that “[c]hildren experiencing poverty tend to be worse off in a range of ways, including being more likely to enter school behind their peers, scoring lower on achievement tests, working less and earning less as adults, and having worse health outcomes.”[12] Economic security programs like food assistance, housing subsidies, and the EITC and CTC have long-term as well as immediate benefits, helping children to do better in school and increasing their earning power as adults, the research review showed.
This should not be surprising. This growing body of research evidence is consistent with the common-sense notion that inadequate diets, housing, or health care can make it harder for children to thrive in school and later to obtain jobs paying decent wages. So whether to reduce deprivation among low-income children now or to promote children’s upward mobility in the future, further steps to reduce child poverty deserve to be a priority for the nation’s policymakers.
End Notes
[1] As noted, most analysts consider the SPM to be superior to the official poverty measure because, in addition to government cash benefits, which the official measure takes into account, the SPM takes into account non-cash benefits and taxes and thus reflects a much more comprehensive assessment of the effect of government programs on poverty. The SPM differs from the official poverty measure in several other ways as well, including taking work expenses and geographical differences in the cost of living into account. The government taxes accounted for by the SPM include federal and state income taxes, and federal payroll taxes. The government programs considered include the Earned Income Tax Credit and Child Tax Credit, Social Security, unemployment insurance, workers’ compensation, veterans’ benefits, SNAP, national school lunch program, Special Supplemental Nutrition Program for Women, Infants, and Children (WIC), Temporary Assistance for Needy Families (TANF), state general assistance, Supplemental Security Income, rental subsidies (such as vouchers and public housing) and home energy assistance. Figures for 2008-2010 also include certain temporary federal measures enacted in response to the Great Recession: the 2008 stimulus payment, the 2009 economic recovery payment, and the 2009-2010 Making Work Pay Tax Credit.
[2] Chris Wimer et al., Historical Supplemental Poverty Measure Data, Columbia Population Research Center, 2017, https://www.povertycenter.columbia.edu/.
[3] The “anchored” SPM uses a modernized poverty threshold reflecting living standards in 2012 (as calculated by analysts at the Bureau of Labor Statistics), adjusted in years before and after that for inflation. The anchored SPM differs from the standard or “relative” SPM in that under the latter the poverty-line thresholds grow slightly faster than inflation over time as living standards rise. For this analysis, we use the anchored series to make sure that the trends we find are purely due to changes in families’ resources and not changes in the poverty thresholds. Chris Wimer et al., “Trends in Poverty with an Anchored Supplemental Poverty Measure,” Columbia Population Research Center Working Paper No. 13-01, December 2013, http://cupop.columbia.edu/publications/2013.
[4] Pre-government income includes labor market earnings and other income from private sources, such as interest payments and child support, minus work expenses and out-of-pocket medical expenditures.
[5] In fact, the most recent improvement in child poverty is entirely due to changes before taking government benefits into account. The proportion of children who would otherwise be poor lifted above the poverty line by government benefits was the same in 2016 as in 2014 (38 percent).
[6] During this period, child poverty overall fell somewhat less (by 41 percent) because the share of all children who are children of color has increased.
[7] Operating in the other direction, TANF benefits lift considerably fewer children out of poverty — and have a smaller effect in reducing the severity of poverty — than when the program was established in the mid-1990s.
[8] We use data from the Department of Health and Human Services/Urban Institute TRIM model to correct for underreporting in the Census Bureau data for SNAP, Supplemental Security Income, and TANF. Correcting for the underreporting of SNAP has the largest impact on poverty given that it’s the largest of the three programs that we correct for. The Census Bureau’s data for 2014 showed that SNAP lifted 2 million children out of poverty. That figure corrected for underreporting was 4 million.
[9] Isaac Shapiro, Robert Greenstein, Danilo Trisi, and Bryann DaSilva, “It Pays to Work: Work Incentives and the Safety Net,” CBPP, March 3, 2016, https://www.cbpp.org/sites/default/files/atoms/files/3-3-16tax.pdf.
[10] Yonatan Ben-Shalom, Robert Moffitt, and John Karl Scholz, “An Assessment of the Effectiveness of Anti-Poverty Programs in the United States,” Institute for Research on Poverty, Discussion Paper no. 1392.11, revised June 2011.
[11] Janet C. Gornick and Emily Nell, “Children, Poverty, and Public Policy: A Cross-National Perspective,” LIS Working Paper Series, May 2017, Table 2. The other countries in this study were Australia, Denmark, Estonia, Finland, France, Iceland, Ireland, Luxembourg, the Netherlands, Norway, Poland, and the Slovak Republic. Table 2 uses a relative poverty measure that considers a child poor if they live in a household with less than half the nation’s median disposable income.
[12] Arloc Sherman and Tazra Mitchell, “Economic Security Programs Help Low-Income Children Succeed Over Long Term, Many Studies Find,” CBPP, July 17, 2017, https://www.cbpp.org/research/poverty-and-inequality/economic-security-programs-help-low-income-children-succeed-over.
Más de los autores