A Lost Decade in Higher Education Funding
State Cuts Have Driven Up Tuition and Reduced Quality
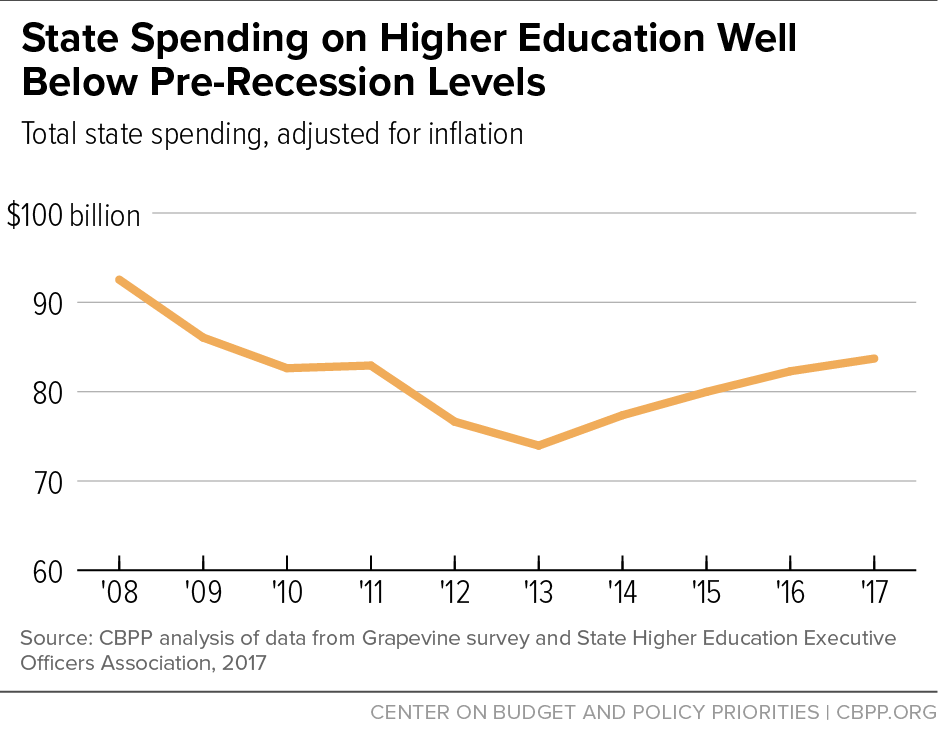
A decade since the Great Recession hit, state spending on public colleges and universities remains well below historic levels, despite recent increases. Overall state funding for public two- and four-year colleges in the 2017 school year (that is, the school year ending in 2017) was nearly $9 billion below its 2008 level, after adjusting for inflation. (See Figure 1.) The funding decline has contributed to higher tuition and reduced quality on campuses as colleges have had to balance budgets by reducing faculty, limiting course offerings, and in some cases closing campuses. At a time when the benefit of a college education has never been greater, state policymakers have made going to college less affordable and less accessible to the students most in need.
state spending on public colleges and universities remains well below historic levels, despite recent increases.
As states have slashed higher education funding, the price of attending public colleges has risen significantly faster than what families can afford. For the average student, increases in federal student aid and the availability of tax credits have not kept up, jeopardizing the ability of many to afford the college education that is key to their long-term financial success.
With many states facing revenue shortfalls in the current or upcoming fiscal year, state lawmakers must renew their commitment to high-quality, affordable public higher education by increasing the revenue these schools receive.[2] By doing so, they can help build a stronger middle class and develop the entrepreneurs and skilled workers needed for a strong state economy.
After adjusting for inflation:[3]
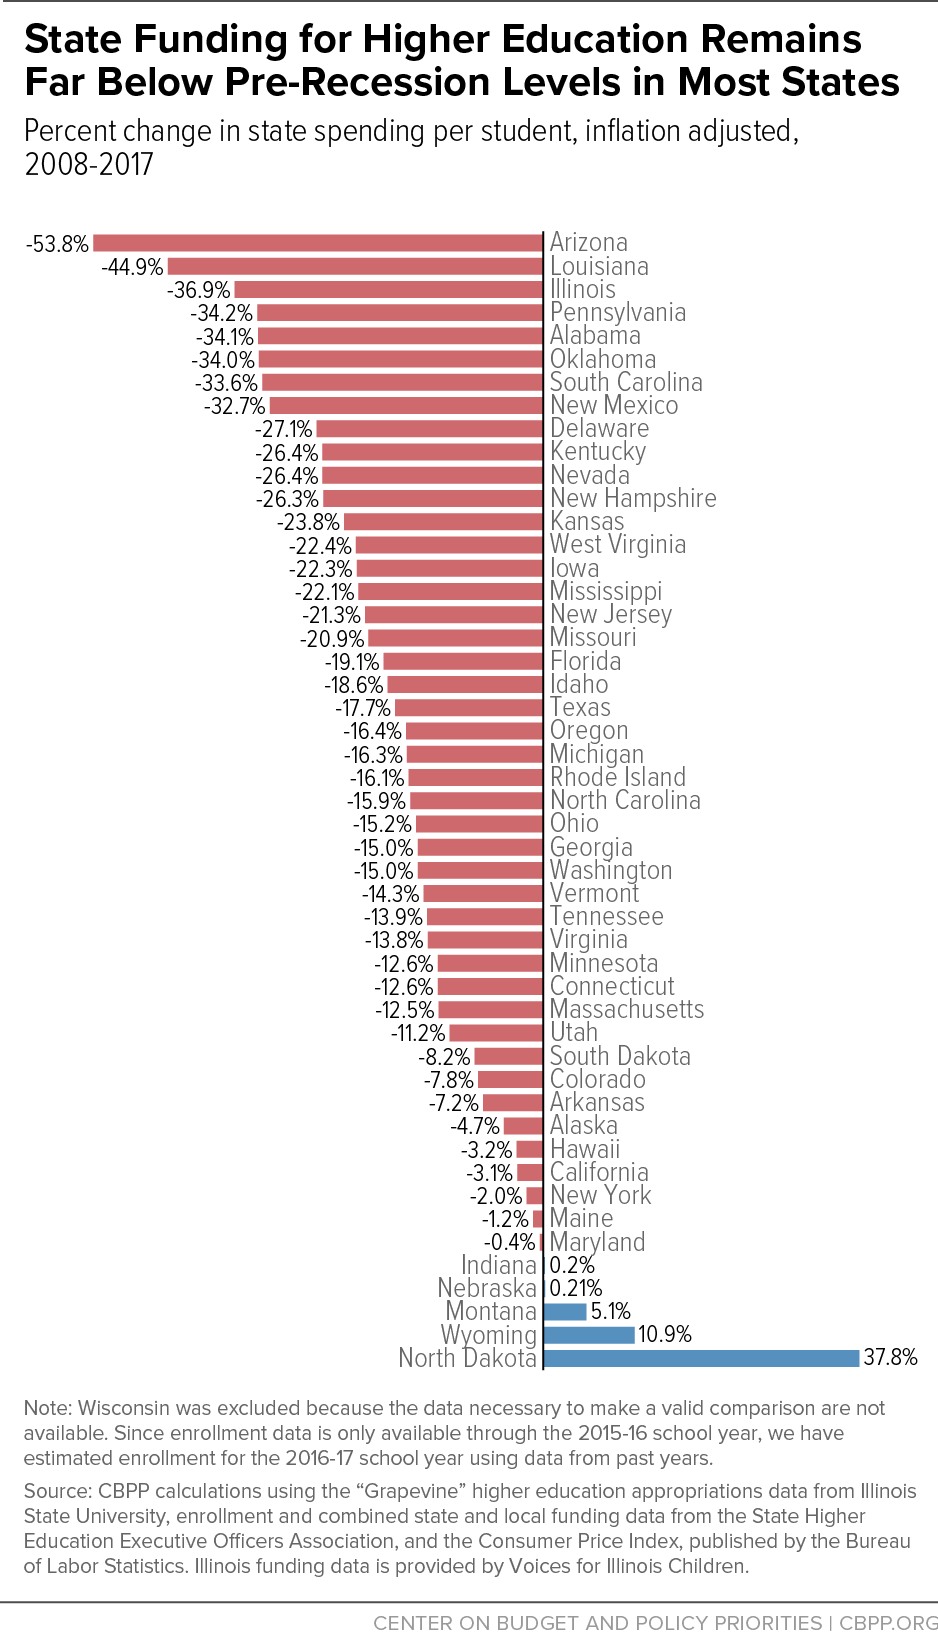
- Of the 49 states (all except Wisconsin)[4] analyzed over the full 2008-2017 period, 44 spent less per student in the 2017 school year than in 2008.[5] The only states spending more than in 2008 were Indiana, Montana, Nebraska, North Dakota, and Wyoming.
- States cut funding deeply after the recession hit. The average state spent $1,448, or 16 percent, less per student in 2017 than in 2008.
- Per-student funding in eight states — Alabama, Arizona, Illinois, Louisiana, New Mexico, Oklahoma, Pennsylvania, and South Carolina — fell by more than 30 percent over this period.
- In 13 states, per-student funding fell between the 2016 and 2017 school years. In five of these states — Alaska, Kansas, Oklahoma, West Virginia, and Wisconsin — funding also fell the previous year. (The 2016-2017 analysis includes all states except Illinois.)[6]
- In 36 states, per-student funding rose between the 2016 and 2017 school years. Per-student funding rose $170, or 2.2 percent, nationally.
Deep state funding cuts have had major consequences for public colleges and universities. States (and, to a lesser extent, localities) provide roughly 53 percent of the costs of teaching and instruction at these schools.[7] Schools have made up the difference with tuition increases, cuts to educational or other services, or both.
Since the recession took hold, higher education institutions have:
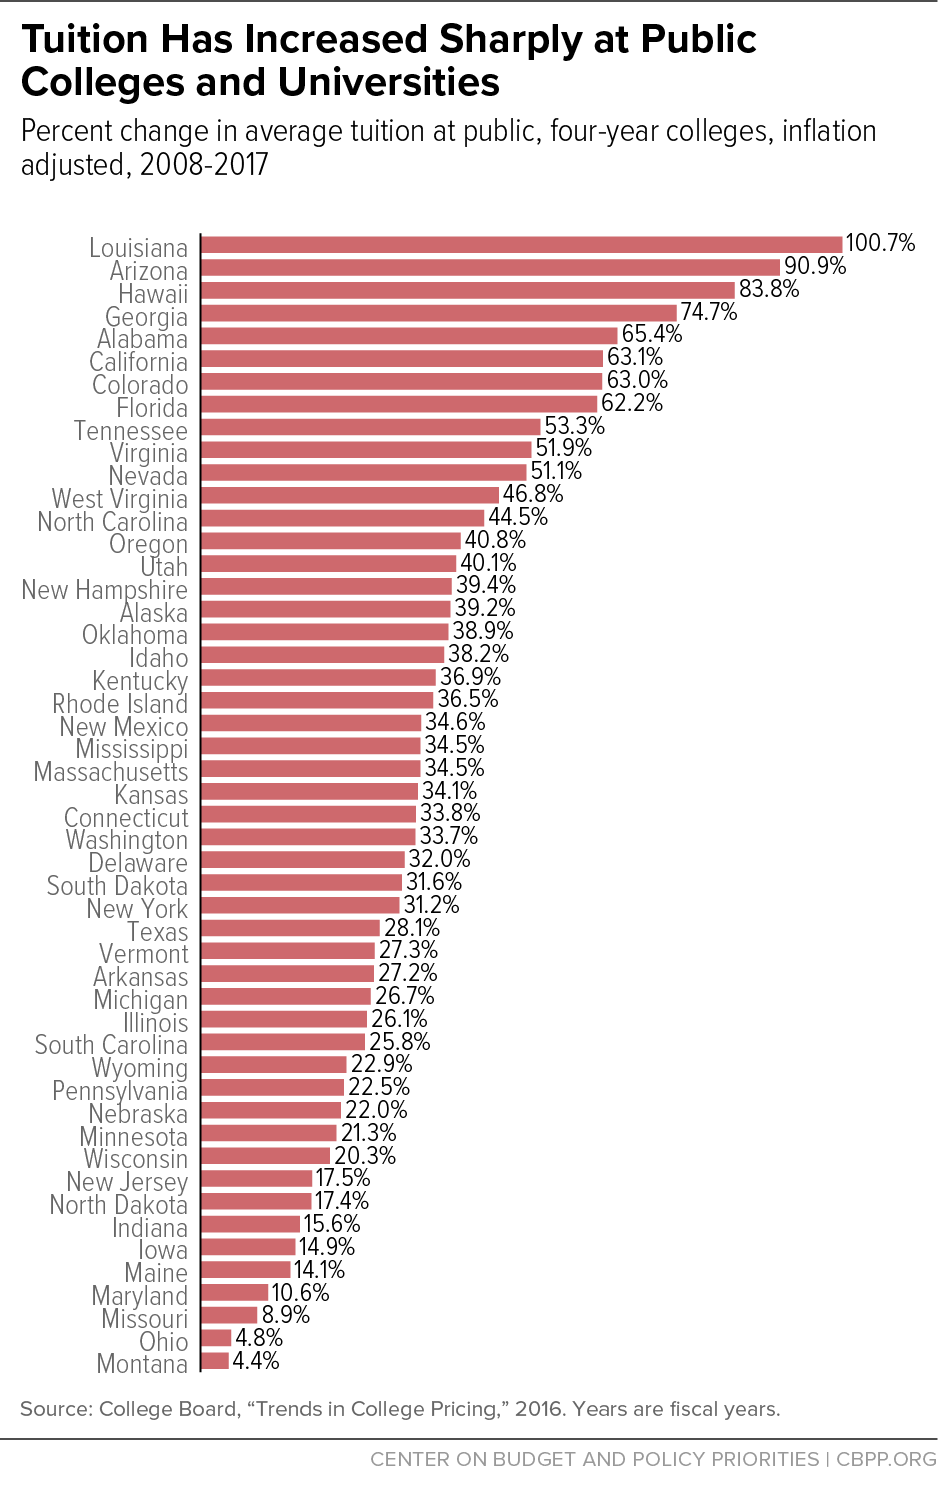
- Raised tuition. Annual published tuition at four-year public colleges has risen by $2,484, or 35 percent, since the 2008 school year.[8] In Louisiana, published tuition at four-year schools has doubled, while in seven other states — Alabama, Arizona, California, Colorado, Florida, Georgia, and Hawaii — published tuition is up more than 60 percent.
These sharp tuition increases have accelerated longer-term trends of college becoming less affordable and costs shifting from states to students. Over the last 20 years, the price of attending a four-year public college or university has grown significantly faster than the median income.[9] Although federal student aid has risen, on average it has fallen short of covering the increases in tuition and other college expenses.
- Reduced academic opportunities and student services. Tuition increases have compensated for only part of the revenue loss resulting from state funding cuts. Over the past several years, public colleges and universities have cut faculty positions, eliminated course offerings, closed campuses, and reduced student services, among other cuts.
A large and growing share of future jobs will require college-educated workers.[10] Sufficient public investment in higher education to keep quality high and tuition affordable, and to provide financial aid to students who need it most, would help states develop the skilled and diverse workforce they will need to compete for these jobs.
Sufficient public investment can only occur, however, if policymakers make sound tax and budget decisions. State revenues have improved significantly since the depths of the recession, but many states are now experiencing new budget pressures — two-thirds of the states are facing or have addressed revenue shortfalls this fiscal year, next year, or both.[11] To make college more affordable and increase access to higher education, many states need to consider new revenue to fully make up for years of cuts.
States Have Only Partially Reversed Funding Cuts
State and local tax revenue is a major source of support for public colleges and universities. Unlike private institutions, which rely more heavily on charitable donations and large endowments to help fund instruction, public two- and four-year colleges typically rely heavily on state and local appropriations. In 2016, state and local dollars constituted 53 percent of the funds these institutions used directly for teaching and instruction.[12]
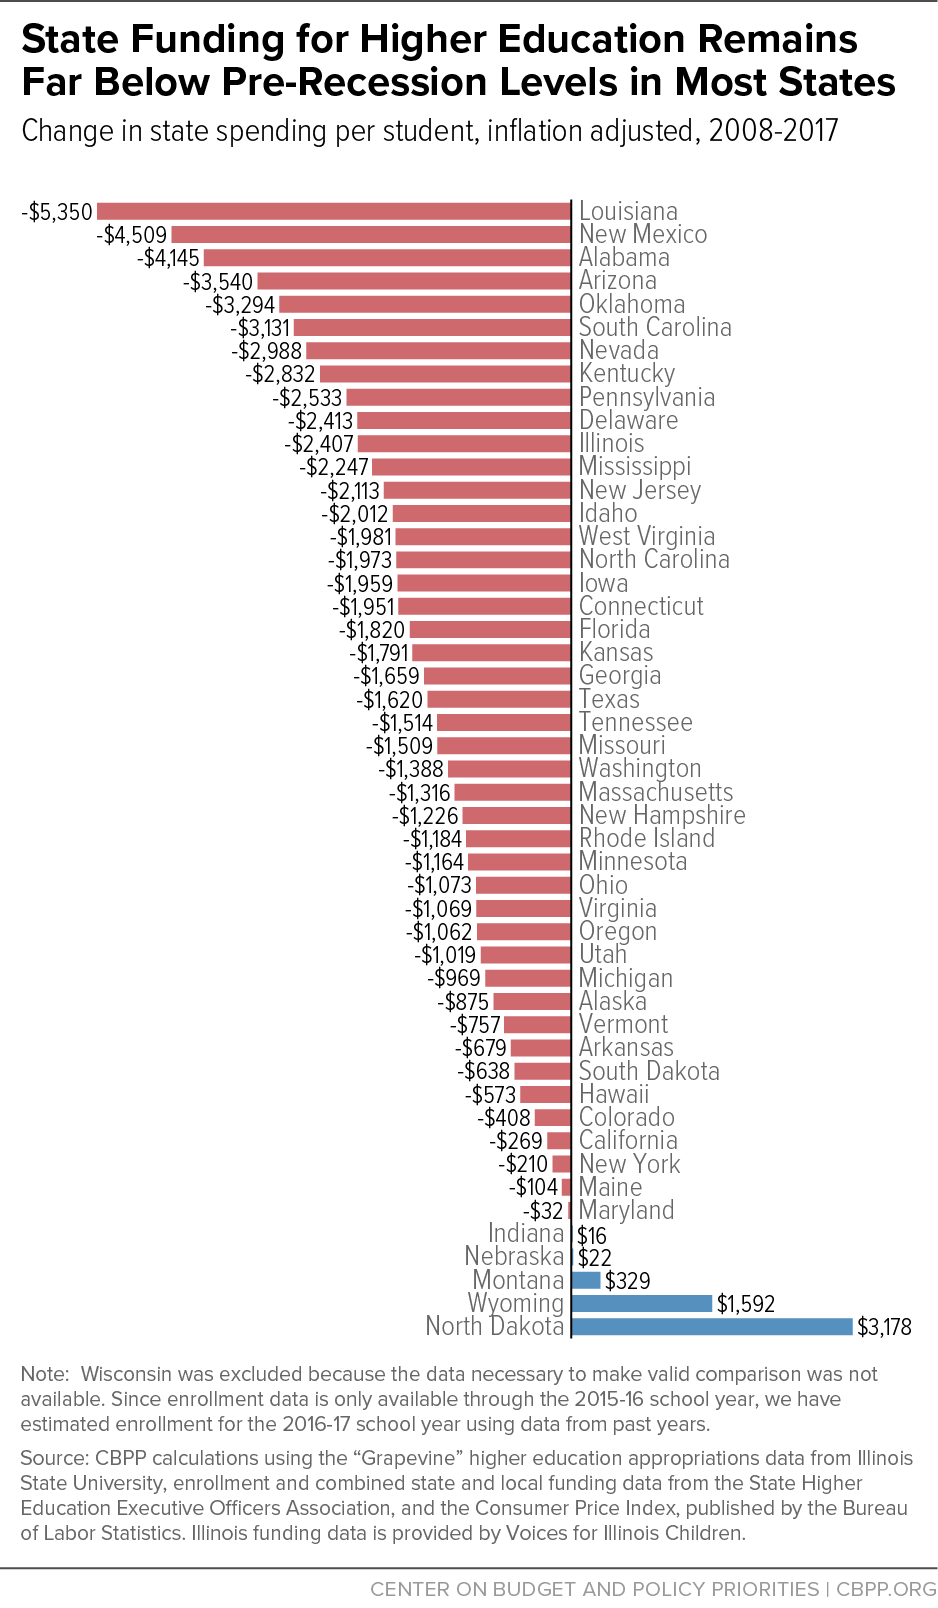
While states have been reinvesting in higher education for the past few years, resources are well below 2008 levels — 16 percent lower per student — even as state revenues have returned to pre-recession levels. (See Figures 2 and 3.) Between the 2008 school year (when the recession hit) and the 2017 school year, adjusted for inflation:
- State spending on higher education nationwide fell $1,448 per student, or 16 percent, after adjusting for inflation.
- Per-student funding rose in only five states: Indiana, Montana, Nebraska, North Dakota, and Wyoming.
- Eighteen states cut funding per student by more than 20 percent, and in eight of those states the cut exceeded 30 percent.
- Arizona cut per-student funding by more than half.[13]
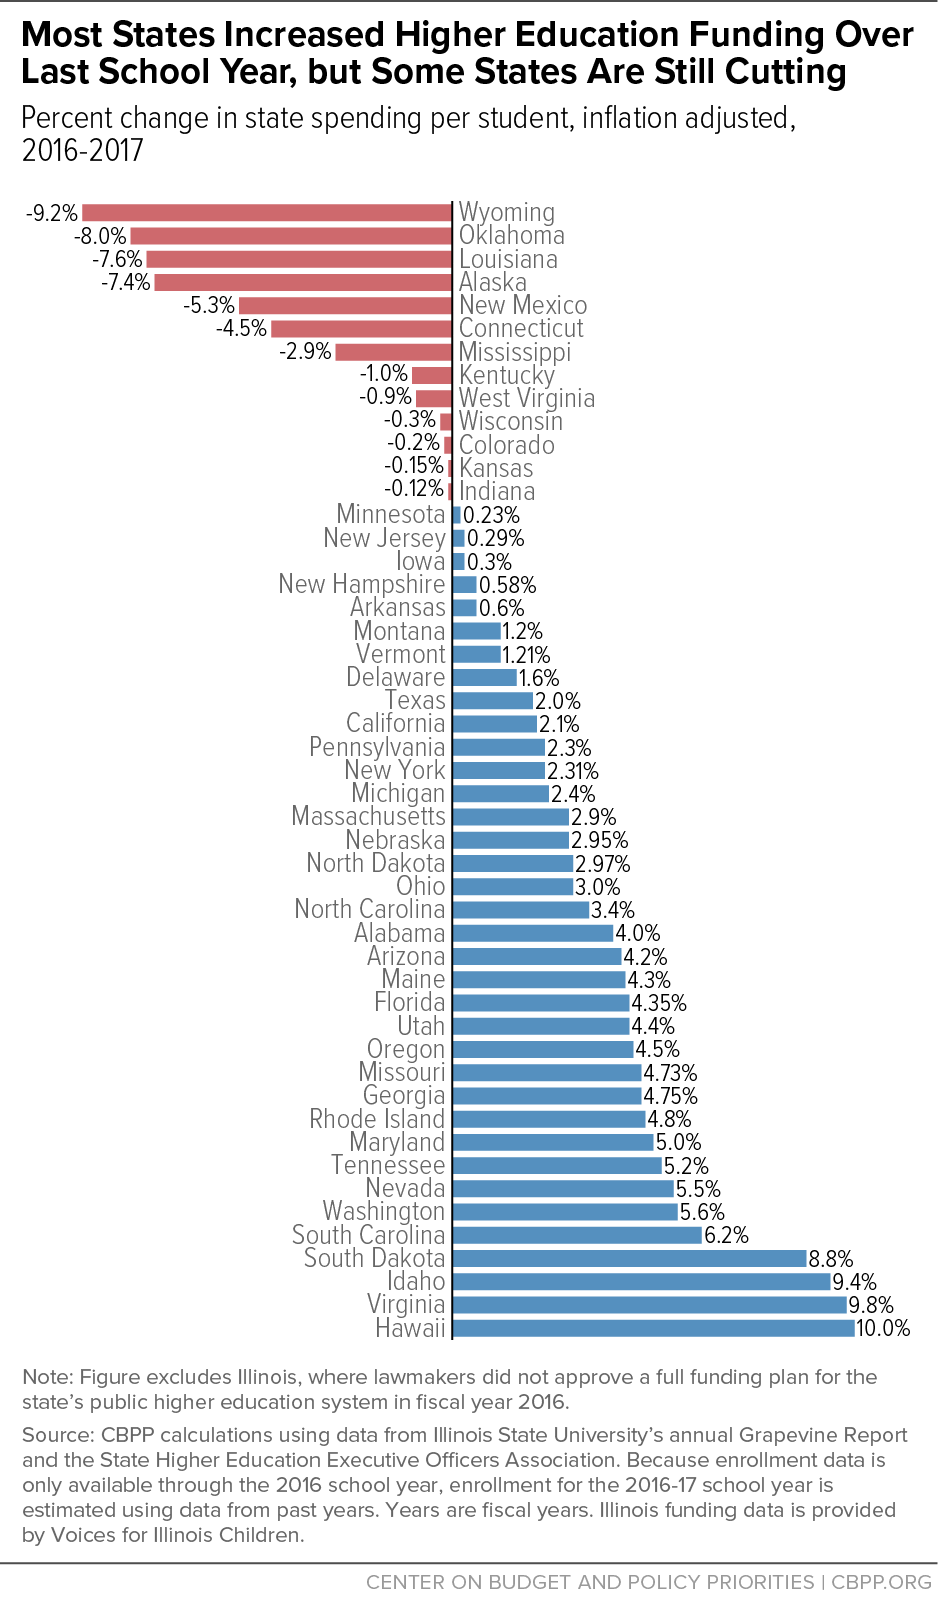
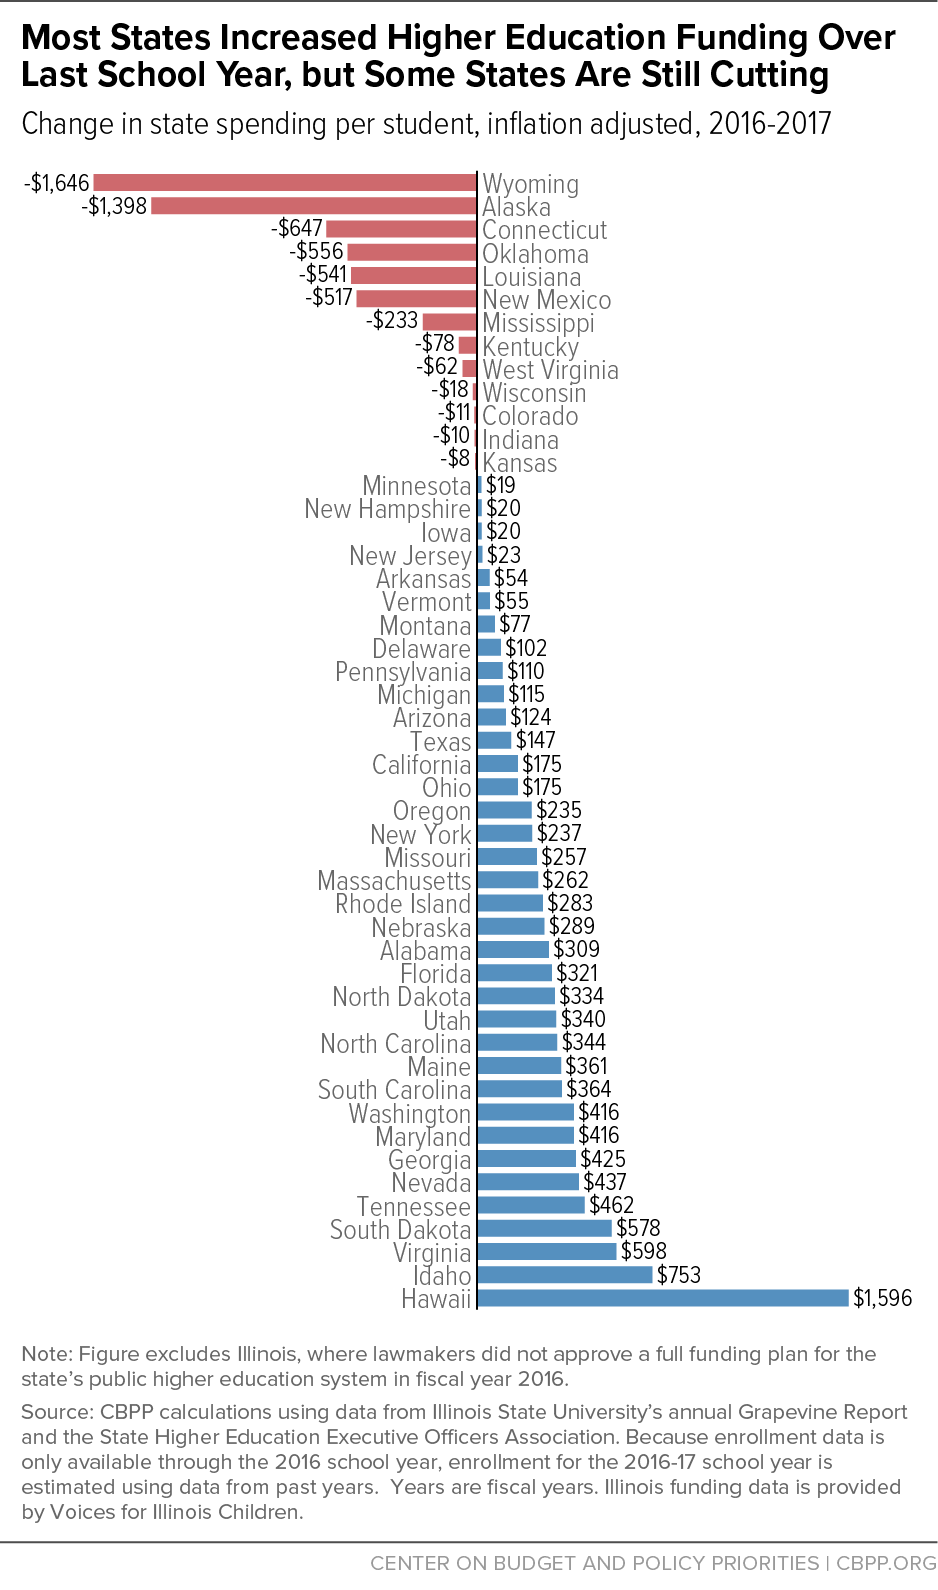
Between the 2016 and 2017 school years, 36 of the 49 states analyzed raised per-student funding for public higher education. (See Figures 4 and 5.)
- Nationally, spending rose $170 per student, or 2.2 percent, on average.
- The funding increases varied from $19 per student in Minnesota to $1,596 in Hawaii.
- Nine states raised per-student funding by more than 5 percent; Hawaii's increase exceeded 10 percent.
In 13 states, per-student funding fell between 2016 and 2017, by 3.7 percent or roughly $440 per student, on average.
- The funding cuts varied from $8 per student in Kansas to $1,646 in Wyoming.
- Six states — Alaska, Connecticut, Louisiana, New Mexico, Oklahoma, and Wyoming — cut funding by more than $500 per student.
- Five states — Alaska, Kansas, Oklahoma, West Virginia, and Wisconsin — cut per-student funding in both 2016 and 2017.
But just as most states are putting resources back into higher education, momentum for reinvestment appears to be slowing. In 28 states, funding increases between 2016 and 2017 were lower than the average increase over the previous three years.
After Recession Hit, States Cut Funding Even as Enrollment Rose
Reductions in support for public colleges reflect in part the strategy that many states chose during the deep national recession and slow recovery.
- State tax revenues fell sharply during the Great Recession. The recession of 2007-09 led to record-breaking declines in state revenues, and the slow recovery prolonged its impact. High unemployment and a slow recovery in housing values left people with less income and less purchasing power. As a result, states took in less from income and sales taxes, their main revenue sources for funding education and other services. By the fourth quarter of 2016, nine years after the recession hit, total state and local tax revenues were 11 percent above pre-recession levels, after adjusting for inflation.[14]
- Many states chose to close their budget deficits through sizeable budget cuts rather than a more balanced mix of spending reductions and revenue increases. States relied disproportionately on damaging cuts to deal with declining revenue over the course of the recession. Between fiscal years 2008 and 2012, states made up 45 percent of the loss in revenue through reducing support for public services — and only 16 percent through increases in taxes and fees. (They closed the remainder of their shortfalls with federal aid, reserves, and various other measures.) States could have made smaller cuts to higher education if they had chosen to raise additional revenue.
- Meanwhile, college enrollment has risen. Enrollment surged rapidly during the recession, particularly at community colleges, as many high school graduates chose college over dim employment prospects and older workers returned to retool and gain new skills.[15] Enrollment peaked in the 2011 school year with nearly 11.7 million full-time-equivalent students. Enrollment rose by more than 826,000 full-time-equivalent students, or 8.0 percent, between the 2008 and the 2016 academic years (the latest year for which data are available).[16]
Demand for other state services has also risen. For example, states have roughly 1 million more K-12 students than in 2008,[17] and state prison populations — which now total 1.3 million people — have grown, putting pressure on state budgets.[18]
State Cuts Have Helped Drive Up Tuition
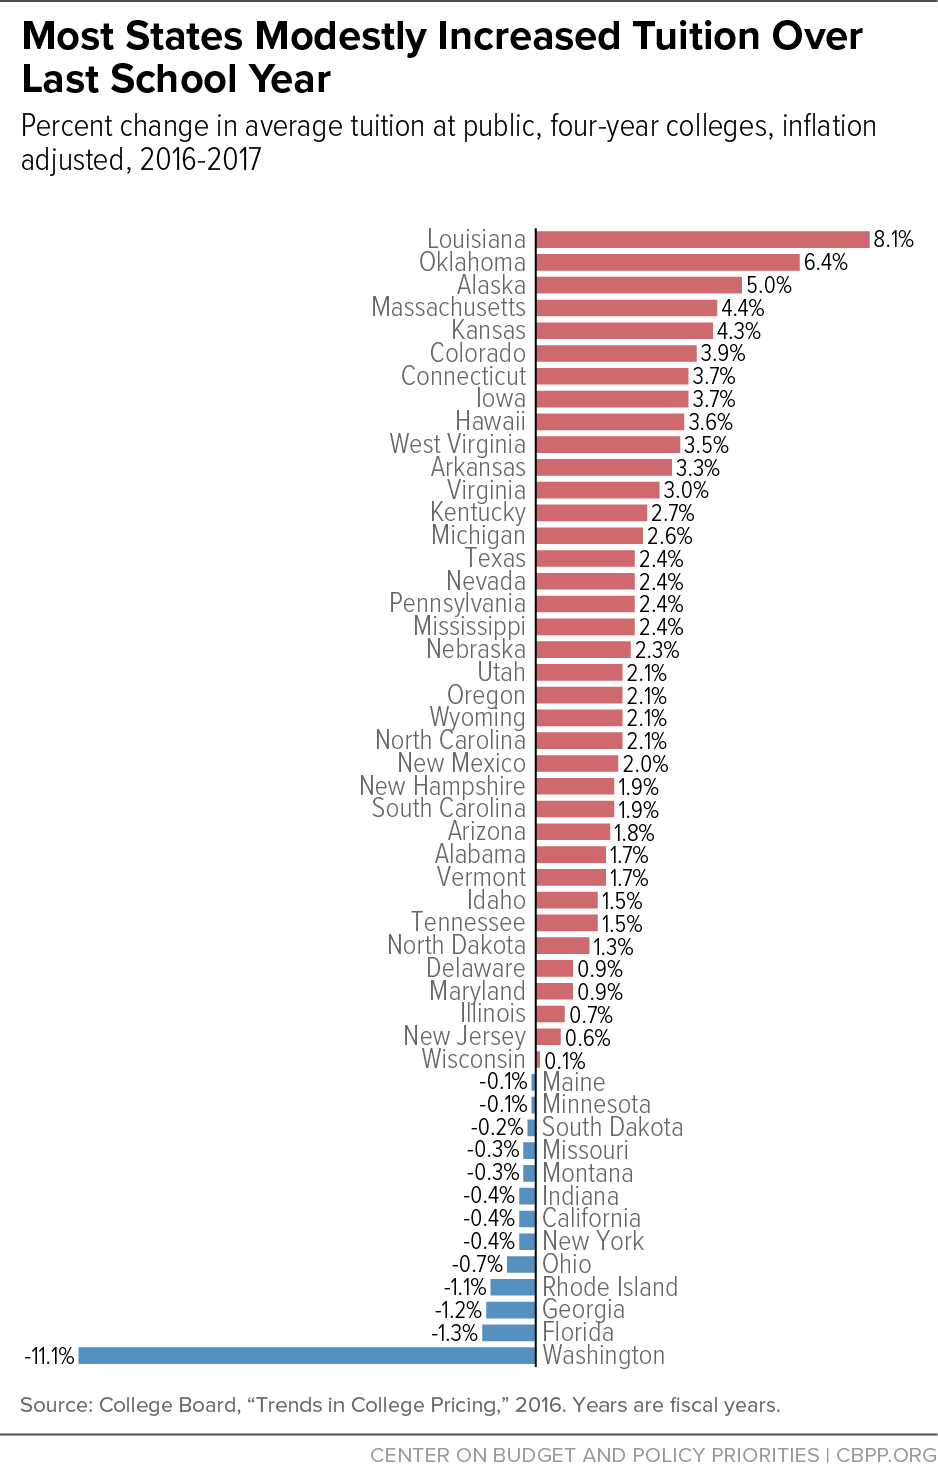
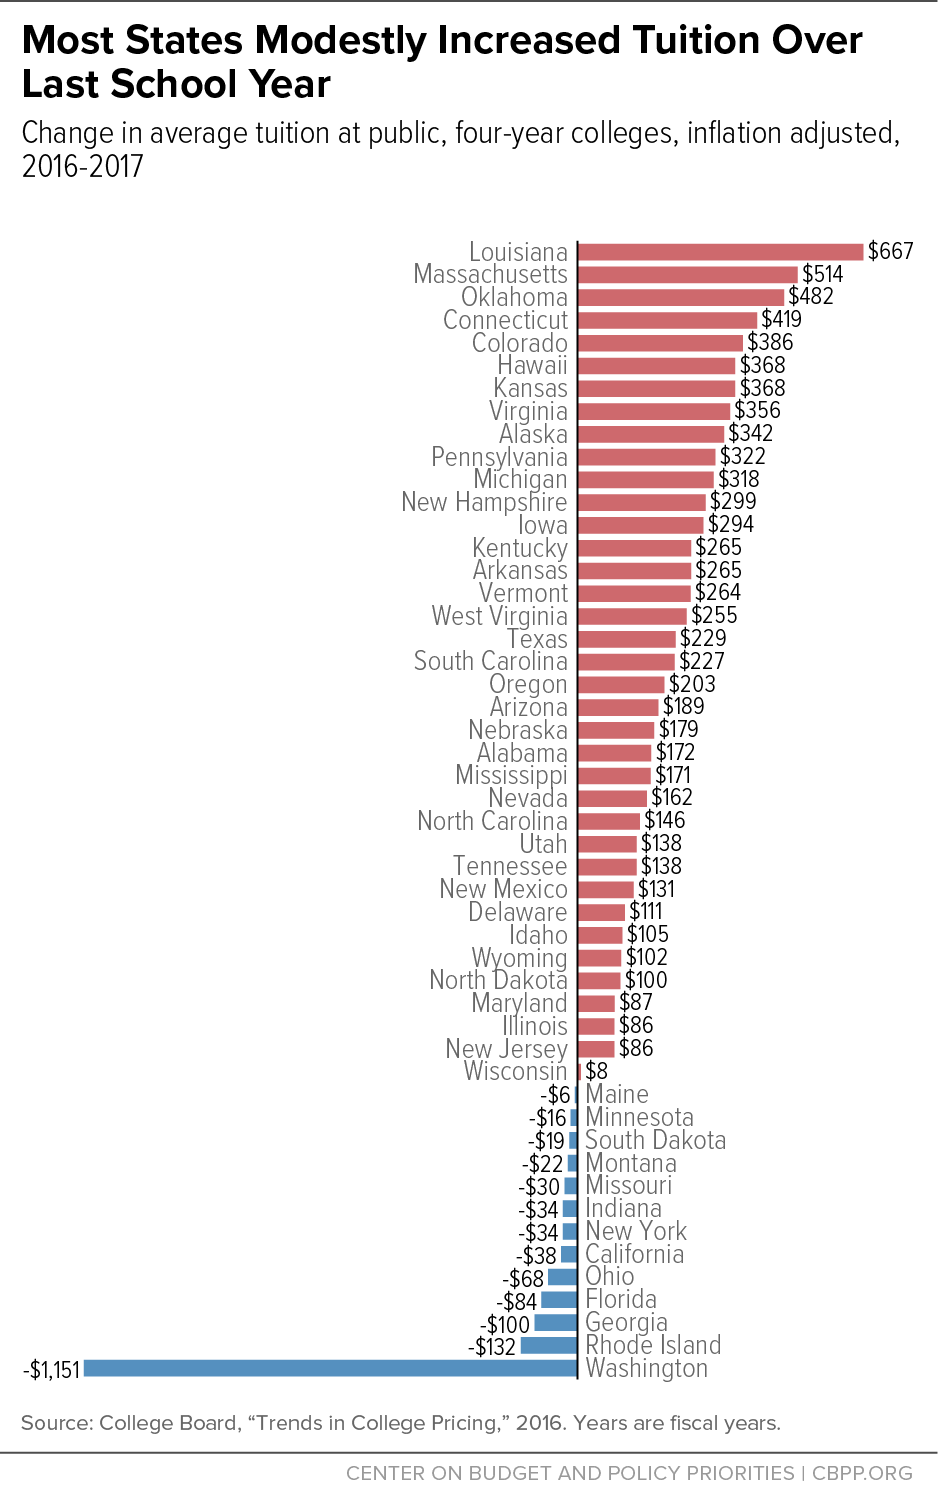
In recent years, as states have modestly increased investment in two- and four-year colleges from their recession lows, tuition hikes have been much smaller than in the worst years of the recession.[19] Published tuition — the "sticker price" — at public four-year institutions rose in 37 states, but only modestly, between the 2016 and 2017 school years:
- Average tuition nationally increased $111, or 1.2 percent, adjusted for inflation.[20]
- Louisiana increased average tuition across its four-year institutions more than any other state, by more than 8 percent, or roughly $667. Louisiana, Oklahoma, and Alaska raised average tuition by more than 5 percent.
- Washington State lowered tuition more than any other state, by more than 11 percent.[21]
Nevertheless, tuition remains much higher than before the recession in most states. Since the 2008 school year, average annual published tuition has risen by $2,484 nationally, or 35 percent.[22]; (See Figures 6 and 7.) Steep increases have been widespread; average tuition at public four-year institutions has increased by:
- more than 60 percent in eight states;
- more than 40 percent in 15 states; and
- more than 20 percent in 41 states.
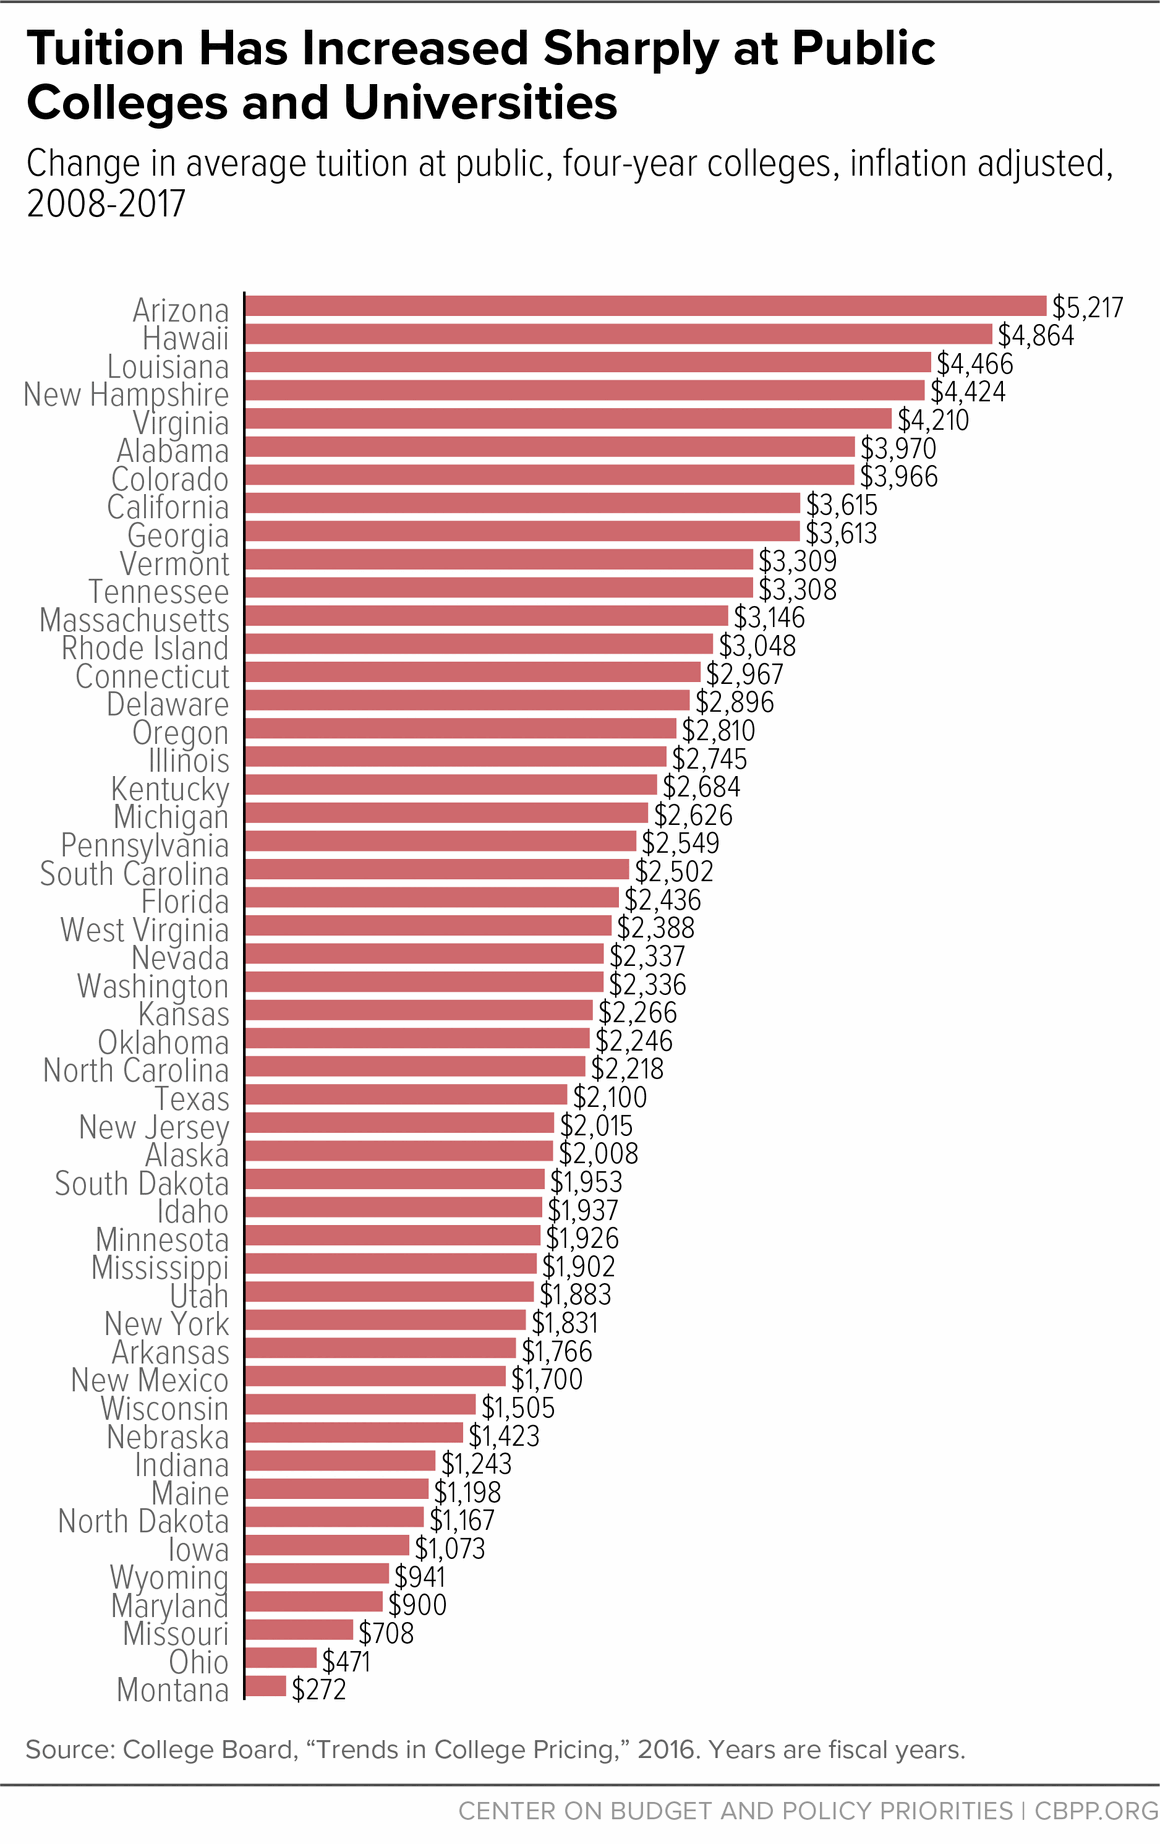
In Louisiana, the state with the largest percentage increase since the recession hit, tuition has doubled, rising $4,466 per student since 2008. Average tuition at a four-year Louisiana public university is now $8,900 a year.[23]
In Arizona, the state with the largest dollar increase since the recession hit, tuition has risen $5,217 per student, or 90.9 percent. Average tuition at a four-year Arizona public university is now $10,957 a year.[24]
Public Colleges and Universities Also Have Cut Staff and Eliminated Programs
Tuition increases, while substantial in most states, have fallen far short nationally of fully replacing the per-student support that public colleges and universities have lost due to state funding cuts. In nearly half of the states, tuition increases between 2008 and 2016 have not fully offset cuts to state higher education funding.[25]
Because of this fact, and because most public schools lack significant endowments or other funding sources, many public colleges and universities have simultaneously reduced course offerings, student services, and other campus amenities over the years.
Data on spending at public colleges in recent years are incomplete, but evidence suggests that these actions likely reduced the quality and availability of institutions' academic offerings. For example, since the start of the recession, colleges and university systems in some states have eliminated administrative and faculty positions (sometimes replacing them with non-tenure-track staff), cut courses or increased class sizes, and in some cases, consolidated or eliminated whole programs, departments, or schools.[26]
These types of cuts have continued even as states have begun reinvesting in higher education. For example:
- Eastern Illinois University eliminated nearly a quarter (413) of its positions, mandated last year that all administrative and professional personnel take 18 furlough days, and extended vendor payments, among other steps.[27]
- The Kansas Board of Regents cut nearly $900,000 in student scholarships across the state's public university system.[28]
- The Kentucky Community and Technical College System cut 191 faculty positions and 315 staff posts, laying off 170 employees and eliminating 336 vacant positions.[29]
- New Mexico State University reduced employee health services and other benefits in addition to eliminating 120 positions.[30]
Funding Cuts, Tuition Increases Shift Costs from States to Students
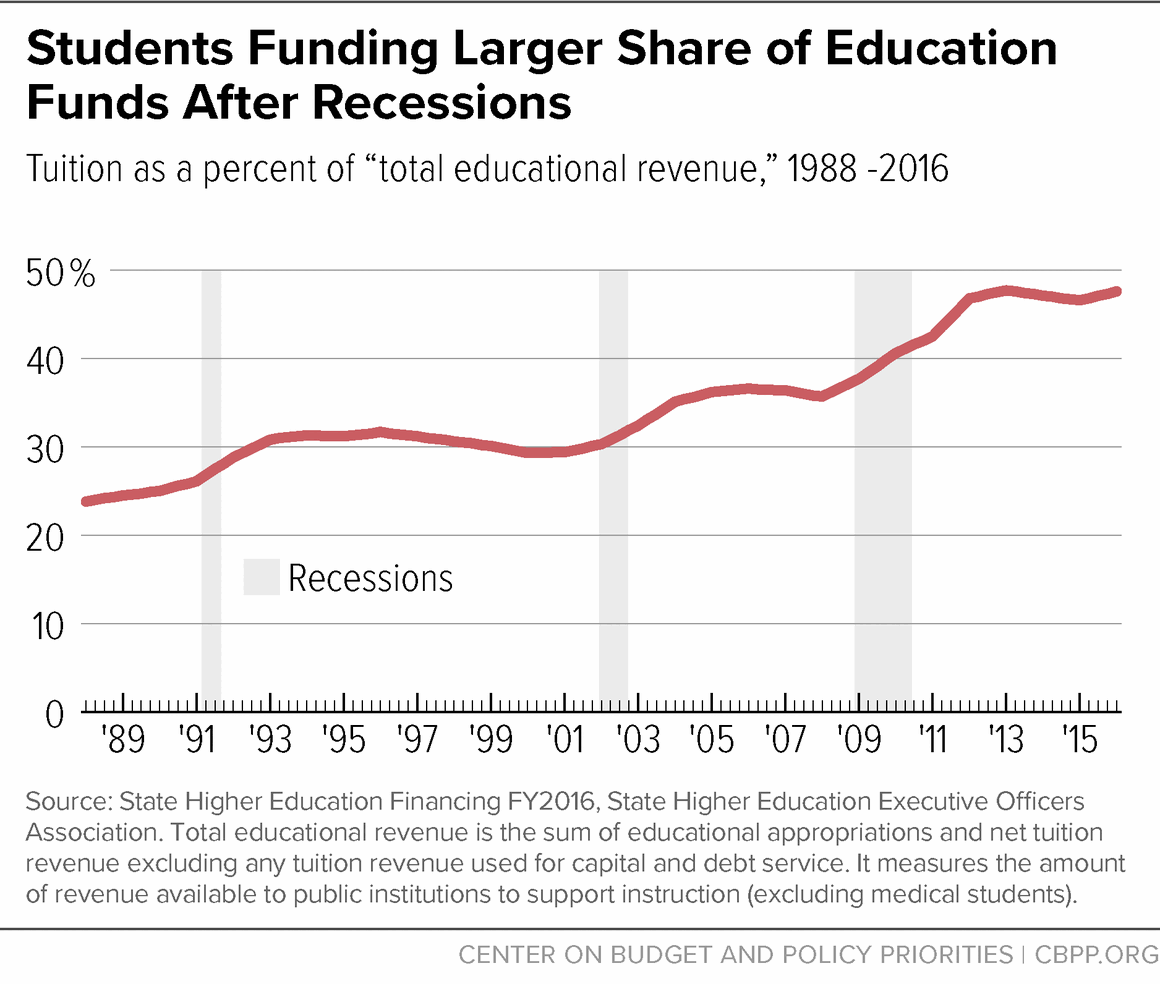
Over time, students have assumed much greater responsibility for paying for public higher education. That's because during and immediately following recessions, state and local funding for higher education tends to fall, while tuition tends to grow more quickly. During periods of economic growth, funding tends to recover somewhat, while tuition stabilizes at a higher share of total higher educational funding.[31] (See Figure 8.)
In 1988, students provided around one-third as much revenue to public colleges and universities as state and local governments did. Today, students provide nearly as much revenue as state and local governments.
Nearly every state has shifted costs to students over the last 25 years, with the most drastic shift occurring since the onset of the Great Recession. In 1988, average tuition exceeded per-student state expenditures in only two states: New Hampshire and Vermont. By 2008, that number had grown to ten states. In 2016 (the latest year for which there are data), tuition revenue exceeded state and local funding for higher education in half the states. And in nine states — Alabama, Colorado, Delaware, Illinois, Michigan, New Hampshire, Pennsylvania, South Dakota, and Vermont — tuition revenue was at least twice state and local funding.[32]
Families Have Been Hard-Pressed to Absorb Rising Tuition Costs
The cost shift from states to students has happened over a period when many families have had trouble absorbing additional expenses due to stagnant or declining incomes. In the 1970s and early to mid-1980s, tuition and incomes both grew modestly faster than inflation; by the late 1980s, tuition began to rise much faster than incomes. (See Figure 9.)
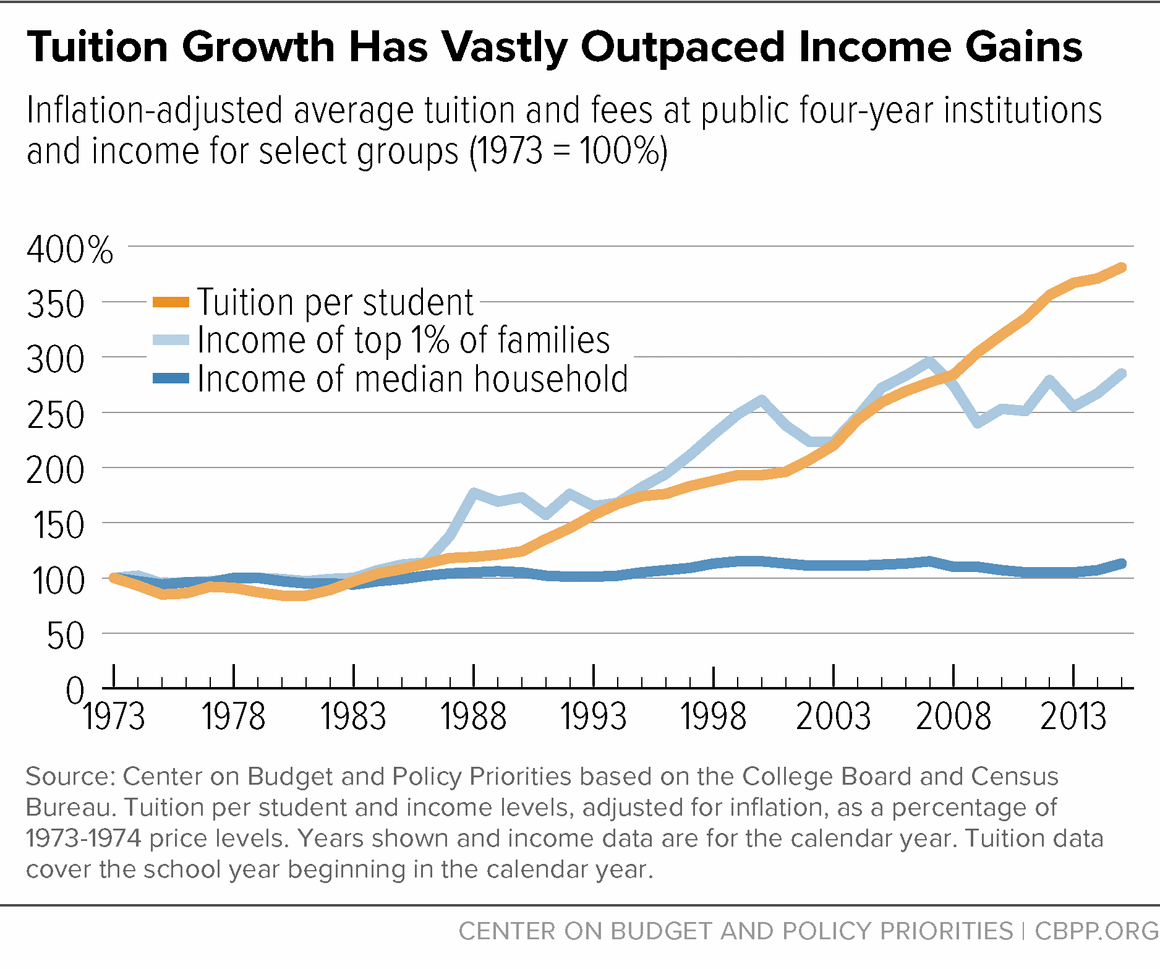
- Between 1973 and 2015, average inflation-adjusted public college tuition has risen by 281 percent, while median household income has grown by only 13 percent.
- Over this period, the incomes of the top 1 percent of families have grown by about 186 percent. This means that public college tuition has outpaced income growth for even the highest earners.
- The sharp tuition increases since the recession have exacerbated the longer-term trend. Tuition jumped more than 34 percent between the 2008 and 2015 school years, while real median income grew merely 2.1 percent.
Cost Shift Harms Students and Families, Especially Those With Low Incomes
Rapidly rising tuition at a time of weak or declining income growth has damaging consequences for families, students, and the national economy.
- Tuition costs deter some students from enrolling in college. While the recession encouraged many students to enroll in higher education, the large tuition increases of the past few years may have prevented further enrollment gains. Rapidly rising tuition makes it less likely that students will attend college; research consistently finds that college price increases result in declining enrollment.[33] While many universities and the federal government provide financial aid to students, research suggests that a high sticker price can dissuade students from enrolling even if the net price, including aid, doesn't rise.
- Rising tuition may harm students of color and reduce campus diversity. Rising tuition and fees jeopardize campus diversity at public four-year colleges because students of color are less likely to enroll as the cost of tuition goes up. "All else equal, a $1,000 tuition increase for full-time undergraduate students is associated with a drop in campus diversity of almost 6 percent," New York University researchers found in a 2015 study.[34] Another study, which examined tuition policy changes in Texas in the early 2000s, concluded that rising tuition limited enrollment gains for Hispanic students in the state.[35] The share of students coming from communities of color at public two- and four-year colleges rose significantly in the years leading up to these tuition increases.[36] State cuts to higher education, which led to tuition increases, jeopardize this trend.
- Tuition increases likely deter low-income students, in particular, from enrolling. College cost increases have the biggest impact on students from low-income families, research shows. For example, a 1995 study by Harvard University researcher Thomas Kane concluded that states with the largest tuition increases during the 1980s and early 1990s "saw the greatest widening of the gaps in enrollment between high- and low-income youth."[37] Low-income families' relative lack of knowledge about the admissions and financial aid processes may exacerbate the problem. Students from families that struggle to get by — including those who live in communities with lower shares of college-educated adults and attend high schools that have higher student-to-counselor ratios — tend to overestimate the true cost of higher education more than students from wealthier households, in part because they are less aware of the financial aid for which they are eligible.[38]
These effects are particularly concerning because gaps in college enrollment between higher- and lower-income youth are already pronounced. In 2015, 58 percent of recent high school graduates from families with income in the lowest 20 percent enrolled in some form of postsecondary education, compared to 82 percent of students from the top 20 percent.[39] Significant enrollment gaps based on income exist even among prospective students with similar academic records and test scores.[40] Rapidly rising costs at public colleges and universities may widen these gaps further.
- Tuition increases may push lower-income students toward less-selective public institutions, reducing their future earnings. Perhaps just as important as a student's decision to enroll in higher education is the choice of which college to attend. A large share of high-achieving students from struggling families fail to apply to any selective colleges or universities, a 2013 Brookings Institution study found.[41] Even here, research indicates that financial constraints and concerns about costs push lower-income students to narrow their list of potential schools and ultimately enroll in less-selective institutions.[42] Another 2013 study found evidence that some high-achieving, low-income students are more likely to "undermatch" in their college choice, in part due to financial constraints.[43]
Where a student decides to go to college has broad economic implications, especially for economically disadvantaged students and students of color. Students with less-educated parents, as well as African American and Latino students, benefit especially from attending more elite colleges — experiencing higher postgraduate earnings, a 2011 study by Stanford University and Mathematica Policy Research found.[44]
Federal Financial Aid Is Up Since the Recession
As tuition soared after the recession, federal financial aid increased. Total Pell Grant aid, the nation's primary source of student grant aid, rose by 68 percent between the 2008 and 2016 school years. This substantial boost has enabled the program not only to reach more students ― 2 million more students received Pell support last year than in 2008 ― but also to provide the average recipient with more support.[45] The average grant rose by 23 percent, to $3,724 from $3,034.[46]
Increased federal financial aid has helped many students and families cover recent tuition hikes. The College Board calculates that the annual value of grant aid and higher education tax benefits for students at four-year public colleges nationally has risen by an average of $1,780 in real terms since the 2008 school year, offsetting about 71 percent of the average $2,500 tuition increase. For community colleges, increases in student aid have more than made up the difference, leading to a drop in net tuition for the average student.[47]
However, because sticker-price increases have varied so much by state while federal grant and tax-credit amounts are uniform nationally, students in states with large tuition increases — such as Arizona, Hawaii, and Louisiana — likely still experienced substantial tuition and fee increases, while the net cost for students in states with smaller tuition increases may have fallen.
The increase in federal financial aid is now threatened. The Trump Administration has proposed cutting Pell Grants by $4 billion for fiscal year 2018, while the House Appropriations Committee has proposed a $3.3 billion cut. Similarly, the House Budget Committee's 2018 budget resolution calls for eliminating a significant portion of Pell Grant funding altogether, reducing the maximum award for the 2018 school year from $5,920 to $4,860 — an 18 percent cut.[48]
Over Time, State-Based Financial Aid Has Shifted From Need to Merit
States, too, provide financial aid to help students afford college. It is typically divided into two broad categories: need-based (awarded to students who have demonstrated financial need and might otherwise struggle to afford college) and merit-based (awarded to students regardless of financial need). Eligible students are awarded merit aid based off prior academic achievement such as high school GPA, college entry exam scores, or some combination of the two.
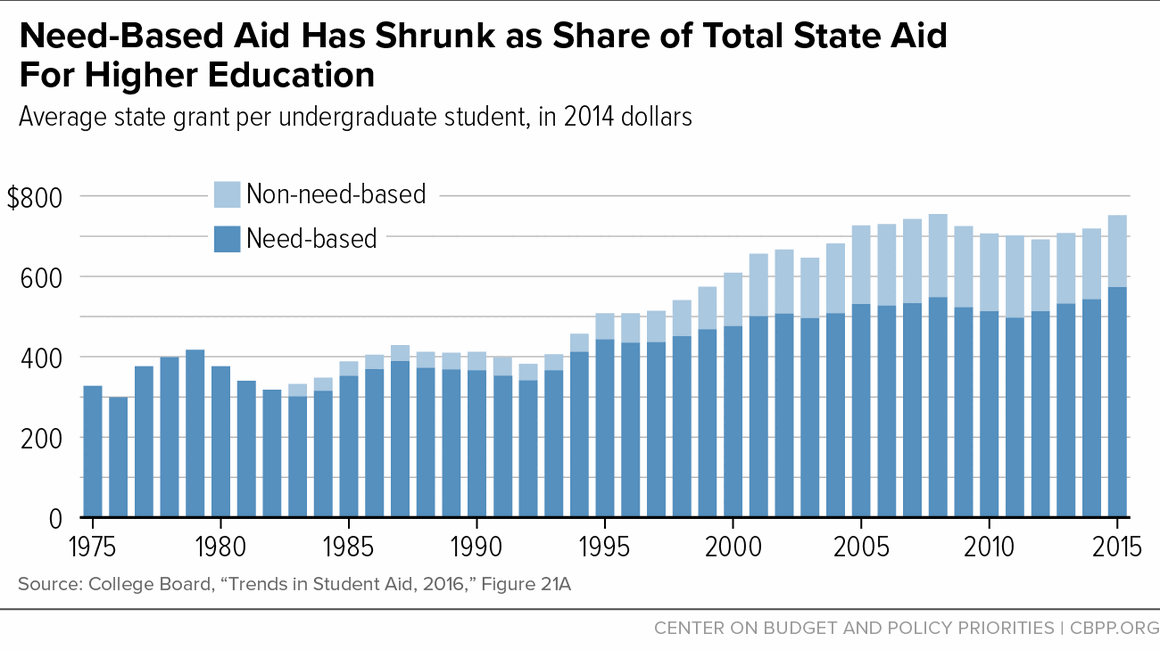
State financial aid is primarily need-based, though merit-based aid has grown as a share of state support over the last two decades, from 10 percent during the 1990s to 24 percent in the 2015 school year.[49] (See Figure 10.)
Overall state aid (need- and merit-based) per student peaked during the 2008 school year, just prior to the recession.[50] Then, even as states reduced funding for public two- and four-year schools, they also cut back on financial aid, which fell each year on a per-student basis until the 2012 school year. Since then, states have slowly reinvested in their state aid programs and need-based aid per student is now back above pre-recession levels. Merit-aid per student has not similarly recovered, however, and overall state-based financial aid per student is still roughly 4 percent below what it was just prior to the recession. In 2015, the most recent year for which these data are available, total state aid per pupil covered 8 percent of total tuition, down from 11 percent in 2007-08.[51]
The growth of merit-based grants as a share of state-funded aid has created concern that they disproportionately go to students who would likely attend college anyway and, on average, shift limited state resources away from lower-income students.[52] Proponents of merit-based aid, on the other hand, argue that it incentivizes high-achieving students to stay in-state for college, with the idea that they would then graduate, find jobs, and contribute to the state's economy. Studies do show that, on average, offering merit-based aid can encourage certain students who would have attended college elsewhere to remain in state, but the effectiveness of such programs depends on the size of the awards and their eligibility criteria.[53]
Need-based aid aims primarily to expand access to higher education to low-income students who may otherwise not attend college at all or would fail to graduate without the additional assistance. Dollar for dollar, the return on state investment is significant. Research indicates that a $1,000 increase in a student's financial aid reduces the student's likelihood of dropping out of college by 9.2 percentage points.[54] To help more young people reach their full potential — and, in turn, boost the state's economy and quality of life — policymakers should target aid dollars at students on the margins and those most hampered by limited resources.
Low-Income Students Still Struggle with Debt
Federal and state financial aid has lessened the impact of tuition and fee increases on students from families with low incomes. However, the overall average cost of attending college has risen for these students, because room and board costs have increased, too. As a result, between 2008 and 2012 the net cost of attendance for low-income students rose by 12 percent at four-year public institutions and by 4 percent at public community colleges.[55]
Because grants and tax credits rarely cover the full cost of college attendance, most students — students of color and low-income students in particular — borrow. Among students graduating with a bachelor's degree in 2012, 79 percent of those from families with incomes in the bottom quarter had student loans, compared with 55 percent of those from families in the top income quarter.[56] In the same year, more than 80 percent of graduating African American students borrowed at public institutions, compared with 64 percent of graduating students overall.[57]
Further, the share of students graduating with debt has risen since the start of the recession. Between the 2008 and 2015 school years, the share of students graduating with debt from a public four-year institution increased from 55 percent to 60 percent. The average amount of debt incurred by a bachelor's degree recipient with loans at a public four-year institution grew as well, to $26,800 from $21,226 (in 2015 dollars), an increase of 26 percent. By contrast, the average level of debt incurred rose only about 1 percent in the six years prior to the recession.[58]
In short, at public four-year institutions, a greater share of students are taking on larger amounts of debt. By the first quarter of 2017, student debt totaled $1.34 trillion — more than the United States population's credit card debt and lines of credit for home equity combined.[59]
Yet, while college loan burdens have increased significantly for students at public four-year institutions, the significant run-up in debt levels has been driven in large part by a growing share of students attending private for-profit institutions — such as Corinthian and the University of Phoenix — and two-year community colleges. In 2000, borrowers entering repayment on student loans from for-profit and two-year institutions made up roughly 30 percent of all borrowers overall, a study from the U.S. Treasury Department and Stanford University researchers found. By 2011, that share had risen to nearly half. For-profit institutions have been such a driving force that in 2014, eight of the top ten and 13 of the top 25 institutions whose students owe (collectively) the most in federal student loan debt were for-profit institutions. (See Table 1.) In 2000, only one for-profit made the top 25.[60]
| TABLE #1 | |||||
|---|---|---|---|---|---|
| For-Profit Institutions Driving Increase in Student Debt | |||||
| 2000 | 2014 | ||||
| Rank | Institution | Total student debt | Rank | Institution | Total student debt |
| 1 | New York University | $2.2B | 1 | University of Phoenix — Phoenix Campus | $35.5B |
| 2 | University of Phoenix — Phoenix Campus | $2.1B | 2 | Walden University | $9.8B |
| 3 | Nova Southeastern University | $1.7B | 3 | Nova Southeastern University | $8.7B |
| 4 | Pennsylvania State University | $1.7B | 4 | DeVry University — Illinois | $8.2B |
| 5 | University of Southern California | $1.6B | 5 | Capella University | $1.6B |
| 6 | Ohio State University — Main Campus | $1.5B | 6 | Strayer University — Global Region | $1.5B |
| 7 | Temple University | $1.5B | 7 | Kaplan University — Davenport Campus | $1.5B |
| 8 | Arizona State University | $1.4B | 8 | New York University | $1.4B |
| 9 | Michigan State University | $1.3B | 9 | Argosy University — Chicago | $1.3B |
| 10 | University of Minnesota — Twin Cities | $1.3B | 10 | Ashford University | $1.3B |
Funding Cuts and Tuition Increases Jeopardize Students' and States' Economic Futures
Reducing college access and graduation rates hurts more than just students. College attainment has grown increasingly important to long-term state and national economic outcomes.
Entire communities benefit when more residents have college degrees. For instance, studies link higher educational attainment with lower crime rates, more civic participation, and better health.[61] Areas with highly educated residents tend to attract strong employers that pay competitive wages. Those employees, in turn, buy goods and services in the community, broadly benefitting the local economy. As a result, the wages of workers at all education levels are higher in metropolitan areas with high concentrations of college-educated residents, economist Enrico Moretti of the University of California at Berkeley finds.[62] This implies that a highly educated workforce can boost an area's economic success.
The economic importance of higher education will likely continue growing. Georgetown University researchers projected in 2013 that by 2020, nearly two-thirds of all jobs will require at least some college education, up from 59 percent in 2007.[63]
The study further projects that, without significant new investment, the nation's education system will not keep pace with the rising demand for educated workers. By 2020, it will produce 5 million fewer college graduates than the labor market will need.[64]
The increase in student debt also has important implications for the broader economy, especially the impact on students who incur debt but do not graduate.[65] Research finds that higher student debt levels are associated with lower homeownership rates among young adults; can reduce the probability of graduation, particularly for students from lower-income families; and reduce the likelihood that graduates with majors in science, technology, engineering, and mathematics will go on to the further academic study often needed to obtain advanced positions in those fields.[66]
Rising debt levels may also prevent some young adults from starting businesses. Many entrepreneurs rely heavily on personal debt to help launch their small businesses, and rising levels of student loan debt may make it more difficult to obtain loans or other lines of credit necessary for launching a startup. Looking at the period from 2000 to 2010, researchers from the Federal Reserve Bank of Philadelphia found that as student loan debt rose, net business formation of the smallest businesses (those employing four or fewer people) fell.[67]
These findings suggest that states should expand college access and increase college graduation rates to help build a strong middle class and develop the entrepreneurs and skilled workers needed to compete in today's global economy. They suggest further that the severe cuts in higher education funding in many states since the start of the recession will make it harder to achieve those goals.
Budget Choices Will Determine Whether States Can Rebuild Higher Education
States have attempted to reinvest in public higher education in recent years but must do much more to fully restore the cuts sustained during and immediately following the Great Recession. In order to do so, state lawmakers will need to reject calls for costly and ineffective tax cuts, and many will need to raise additional revenue.
The need for new revenue is especially pronounced given the significant revenue shortfalls that many states face or will soon face. Due in part to lower-than-expected revenue growth from state sales taxes and capital gains, falling energy prices, and previously enacted tax cuts, 33 states faced revenue shortfalls either in the 2017 fiscal year or in the current 2018 fiscal year (and some have experienced shortfalls in both).[68]
States will also face tough decisions around dealing with federal policy changes. President Trump's 2018 budget contains deep cuts to programs and services that states and localities deliver. In 2018 alone, states and localities would need an additional $44 billion to keep programs funded at existing levels.[69]
Every year, state policymakers face the challenge of adequately funding a host of important public priorities. Elementary and secondary education, like higher education, experienced significant cuts in many states during and after the recession.[70] The nation's system of roads and bridges and other infrastructure is in dire need of new public investments.[71] Human services that reduce poverty and help families rise into the middle class remain crucial at a time of slow wage growth and high levels of child poverty. And while states can achieve savings through corrections reforms, they will need much of those savings for drug treatment and other services that help people avoid crime in the future. Those areas account for more than 70 percent of state funding; the rest of state budgets pay for environmental protection, state court systems, and other essential areas.[72]
This means that to renew state investment in higher education — and prevent further disinvestment — states should reject calls for tax cuts and may want to consider options for new revenues. These revenues could come, for example, from repealing ineffective tax deductions, exemptions, and credits; rolling back past years' tax cuts; or raising certain tax rates.[73]
Tax cuts are often sold as a recipe for economic growth. But to the extent that they prevent investments in higher education that would improve college access and graduation rates and reduce student debt, they could have a net negative effect on the economy.
Conclusion
States have cut higher education funding deeply since the start of the recession. These cuts partly reflected policymakers' decision to rely overwhelmingly on spending cuts rather than revenue increases to make up for lost revenues. A more balanced mix of spending cuts and revenue increases could have lessened the need for higher education funding cuts.
These reductions in support have hurt states' higher education systems. Public colleges have both steeply increased tuition and pared back academic opportunities, often in ways that may compromise the quality of education and jeopardize student success. Students are paying more through increased tuition and are taking on more debt.
For states to sustain investment in higher education and promote college affordability and quality, state tax and budget choices over the coming years must recognize the importance of investing in human capital and quality education. A slow economic recovery and the need to reinvest in other services that states have also cut deeply mean that many states will need to raise revenue to rebuild their higher education systems. At the very least, states must avoid shortsighted tax cuts that would make it much harder for them to invest in higher education, strengthen the skills of their workforce, and create the jobs of the future.
Appendix
| APPENDIX TABLE #1 | ||||
|---|---|---|---|---|
| Change in State Higher Education Appropriations, Enrollment, and Appropriations Per Student, 2007-08 School Year to 2016-17 School Year | ||||
| 2007 - 2008 | 2016 - 2017 | Change | Percent Change | |
| State Appropriations for Higher Education | $91,095,877,493 | $82,229,947,433 | -$8,865,930,061 | -9.7% |
| Full-Time-Equivalent Enrollment at Public Colleges and Universities | 10,028,971 | 10,769,357 | 740,386 | 7.4% |
| State Appropriations Per Full-Time-Enrolled Student | $9,083 | $7,636 | -$1,448 | -15.9% |
End Notes
[1] Nicholas Camilien and David Schupak helped gather data for this report.
[2] Elizabeth McNichol and Samantha Waxman, “Many States Face Revenue Shortfalls: States Can Take Steps to Strengthen Their Tax Systems and Reserves,” Center on Budget and Policy Priorities, March 20, 2017, https://www.cbpp.org/research/state-budget-and-tax/many-states-face-revenue-shortfalls.
[3] This paper uses CPI-U-RS inflation adjustments to measure real changes in costs. Over the past year, the CPI-U-RS increased by 1.25 percent. We use the CPI-U-RS for the calendar year that begins the fiscal/academic year. Unless noted, all figures in this paper are adjusted for inflation.
[4] Wisconsin was excluded from this analysis. In the 2013-15 biennial budget, Wisconsin state lawmakers changed the funding model for Wisconsin’s Technical College System, shifting support from the local property tax to state General Purpose Revenue. This change reflects a shift of roughly $406 million in annual support from the local to state levels in Wisconsin but did not result in an overall increase in support for Wisconsin’s higher education institutions. Excluding this shift, per-student funding fell by $1,626, or 24.8 percent, over 2008-2017.
[5] CBPP calculation using the “Grapevine” higher education appropriations data from Illinois State University, enrollment data from the State Higher Education Executive Officers Association, and the Consumer Price Index, published by the Bureau of Labor Statistics. Since enrollment data are available only through the 2016 school year, enrollment for the 2017 school year is estimated using data from past years.
[6] Illinois was excluded from the 2016-2017 analysis because Illinois did not pass a full funding bill for higher education in fiscal year 2016.
[7] State Higher Education Executive Officers Association, “State Higher Education Finance: FY2016,” April 2017, p. 18, http://sheeo.org/sites/default/files/SHEEO_SHEF_2016_Report.pdf.
[8] Calculated from College Board, “Trends in College Pricing 2016: Average Tuition and Fee and Room and Board Charges, 1971-72 to 2016-17 (Enrollment-Weighted),” Table 2, http://trends.collegeboard.org/college-pricing.
[9] Calculated from “Trends in College Pricing 2016,” Table 2, and the Census Bureau’s “Income, Poverty and Health Insurance Coverage in the United States: 2015,” September 2016, Table A-1, http://www.census.gov/content/dam/Census/library/publications/2014/demo/p60-249.pdf.
[10] Anthony P. Carnevale, Nicole Smith, and Jeff Strohl, “Recovery: Job Growth and Education Requirements through 2020,” Georgetown University Center on Education and the Workforce, June 2013, https://georgetown.app.box.com/s/tll0zkxt0puz45hu21g6.
[11] McNichol and Waxman.
[12] State Higher Education Executive Officers Association, April 2017.
[13] CBPP calculation using the “Grapevine” higher education appropriations data from Illinois State University, enrollment and combined state and local funding data from the State Higher Education Executive Officers Association, and the Consumer Price Index, published by the Bureau of Labor Statistics. Since enrollment data are only available through the 2016 school year, we have estimated enrollment for the 2017 school year using data from past years. The Illinois system of higher education operated without state appropriations for much of the 2017 school year. In June 2016, the legislature approved $1 billion in higher education funding that could be used for expenses in fiscal year 2016 and the first half of fiscal year 2017. To calculate the amount dispersed for 2017, we spread the $1 billion across the 18-month period (applying two-thirds to 2016 and the rest to fiscal year 2017). In July 2017 lawmakers approved an additional $1.2 billion in funding for the 2017 school year such that the final fiscal year 2017 appropriation totals roughly $1.5 billion.
[14] CBPP analysis of Census quarterly state and local tax revenue, http://www.census.gov/govs/qtax/.
[15] See, for example, “National Postsecondary Enrollment Trends: Before, During and After the Great Recession,” National Student Clearinghouse Research Center, July 2011, p. 6, http://pas.indiana.edu/pdf/National%20Postsecondary%20Enrollment%20Trends.pdf. A survey by the American Association of Community Colleges (AACC) indicated that increases in Fall 2009 enrollment at community colleges were, in part, due to workforce training opportunities; see Christopher M. Mullin, “Community College Enrollment Surge: An Analysis of Estimated Fall 2009 Headcount Enrollments at Community Colleges,” AACC, December 2009, http://files.eric.ed.gov/fulltext/ED511056.pdf.
[16] State Higher Education Executive Officers Association, April 2017. While full-time-equivalent enrollment at public two- and four-year institutions is up since fiscal year 2008, between 2014 and 2015 it remained relatively flat after a slight decline in 2013.
[17] National Center for Education Statistics, Enrollment in public elementary and secondary schools, by level and grade: Selected years, fall 1980 through fall 2026, Table 203.10, https://nces.ed.gov/programs/digest/d16/tables/dt16_203.10.asp.
[18] CBPP analysis of data from U.S. Department of Justice, Bureau of Justice Statistics.
[19] Costs reported above include both published tuition and fees. Average tuition and fee prices are weighted by full-time enrollment.
[20] As noted earlier, this and other figures in this report have been adjusted for inflation. Of states with increased tuition, the average tuition increased $242, or 2.6 percent.
[21] CBPP analysis using College Board, “Trends in College Pricing 2016,” https://trends.collegeboard.org/sites/default/files/2016-trends-college-pricing-web_1.pdf. See appendix for fiscal years 2016-17 change in average tuition at public four-year colleges.
[22] CBPP analysis using College Board, “Trends in College Pricing 2016,” https://trends.collegeboard.org/sites/default/files/2016-trends-college-pricing-web_1.pdf. In non-inflation-adjusted terms, average tuition is up $3,459 over this period.
[23] Ibid.
[24] Ibid.
[25] CBPP calculations using State Higher Education Executive Officers data.
[26] For a more detailed account of university cuts, see Michael Mitchell, Vincent Palacios, and Michael Leachman, “States Are Still Funding Higher Education Below Pre-Recession Levels,” Center on Budget and Policy Priorities, May 1, 2014, https://www.cbpp.org/cms/?fa=view&id=4135.
[27] Tom Kacich, “Higher-Ed Leaders: More State Cuts Would Be Devastating,” News-Gazette, March 3, 2017, http://www.news-gazette.com/news/local/2017-03-08/higher-ed-leaders-more-state-cuts-would-be-devastating.html.
[28] Sam Zeff, “Kansas Higher Education Takes a Bigger Than Expected Cut, Tuition Could Go Higher,” KCUR, May 18, 2016, http://kcur.org/post/kansas-higher-education-takes-bigger-expected-cut-tuition-could-go-higher#stream/0.
[29] Linda Blackford, “KCTCS cuts 500 faculty, staff positions,” Lexington Herald-Leader, May 18, 2016, http://www.kentucky.com/news/local/education/article78360412.html.
[30] Heath Haussamen, “NMSU releases list of jobs being eliminated,” Las Cruces Sun-News, July 29, 2016, http://www.lcsun-news.com/story/news/education/nmsu/2016/07/29/nmsu-releases-list-jobs-being-eliminated/87730818/.
[31] State Higher Education Executive Officers Association, “State Higher Education Finance: FY2016,” 2017, p. 25, Figure 5, http://sheeo.org/sites/default/files/SHEEO_SHEF_2016_Report.pdf.
[32] State Higher Education Executive Officers Association, April 2017; government funding includes both state and local funding sources.
[33] See, for example, Steven W. Hemelt and Dave E. Marcotte, “The Impact of Tuition Increases on Enrollment at Public Colleges and Universities,” Educational Evaluation and Policy Analysis, September 2011; Donald E. Heller, “Student Price Response in Higher Education: An Update to Leslie and Brinkman,” Journal of Higher Education, Vol. 68, No. 6 (November-December 1997), pp. 624-659.
[34] Drew Allen and Gregory C. Wolniak, “Exploring the Effects of Tuition Increases on Racial/Ethnic Diversity at Public Colleges and Universities,” New York University, 2015, p. 30, http://www.aera.net/Portals/38/Newsroom%20-%20Recent%20Research/Exploring%20the%20Effects%20of%20Tuition%20Increases%20on%20Racial-Ethnic%20Diversity%20at.pdf.
[35] Stella Flores and Justin Shepard, “Pricing Out the Disadvantaged? The Effect of Tuition Deregulation in Texas Public Four-Year Institutions,” The ANNALS of the American Academy of Political and Social Science, Vol. 655, 2014, pp. 99-122.
[36] National Center for Education Statistics, “Total fall enrollment in degree-granting postsecondary institutions, by level and control of institution and race/ethnicity of student: Selected years, 1976 through 2015,” Table 306.20, https://nces.ed.gov/programs/digest/d16/tables/dt16_306.20.asp.
[37] Thomas J. Kane, “Rising Public College Tuition and College Entry: How Well Do Public Subsidies Promote Access to College?” National Bureau of Economic Research, 1995, http://www.nber.org/papers/w5164.pdf?new_window=1.
[38] Eric P. Bettinger et al., “The Role of Simplification and Information in College Decisions: Results from the H&R Block FAFSA Experiment,” National Bureau of Economic Research, 2009, http://www.nber.org/papers/w15361.pdf. For details on the disparity in access to counseling for low-income students, see “Course, Counselor, and Teacher Gaps: Addressing the College Readiness Challenge in High-Poverty High Schools,” Center for Law and Social Policy, June 2015, http://www.clasp.org/resources-and-publications/publication-1/CollegeReadinessPaperFINALJune.pdf.
[39] College Board, “Education Pays: 2016,” https://trends.collegeboard.org/sites/default/files/education-pays-2016-full-report.pdf.
[40] In a 2008 piece, Georgetown University scholar Anthony Carnevale pointed out that “among the most highly qualified students (the top testing 25 percent), the kids from the top socioeconomic group go to four-year colleges at almost twice the rate of equally qualified kids from the bottom socioeconomic quartile.” Anthony P. Carnevale, “A Real Analysis of Real Education,” Liberal Education, Fall 2008, p. 57.
[41] Christopher Avery and Caroline M. Hoxby, “The Missing ‘One Offs’: The Hidden Supply of High-Achieving, Low-Income Students,” National Bureau for Economic Research, Working Paper 18586, 2012, http://www.brookings.edu/~/media/projects/bpea/spring-2013/2013a_hoxby.pdf.
[42] Patrick T. Terenzini, Alberto F. Cabrera, and Elena M. Bernal, “Swimming Against the Tide,” College Board, 2001, http://www.collegeboard.com/research/pdf/rdreport200_3918.pdf.
[43] Eleanor W. Dillon and Jeffrey A. Smith, “The Determinants of Mismatch Between Students and Colleges,” National Bureau of Economic Research, August 2013, http://www.nber.org/papers/w19286. Additionally, other studies have found that undermatching is more likely to occur for students of color. In 2009 Bowen, Chingos, and McPherson found that undermatching was more prevalent for black students — especially black women — than for comparable white students.
[44] Stacey Dale and Alan Krueger, “Estimating the Return to College Selectivity Over the Career Using Administrative Earning Data.” Mathematica Policy Research and Princeton University, February 2011, https://www.mathematica-mpr.com/our-publications-and-findings/publications/estimating-the-return-to-college-selectivity-over-the-career-using-administrative-earning-data.
[45] College Board, “Trends in Student Aid 2016,” October 2016, Table 8, https://trends.collegeboard.org/sites/default/files/2016-trends-student-aid_0.pdf.
[46] College Board, “Trends in Student Aid 2016,” October 2016, Figure 17, https://trends.collegeboard.org/sites/default/files/2016-trends-student-aid_0.pdf.
[47] CBPP calculation using “Trends in College Pricing 2016,” October 2016, Table 7, https://trends.collegeboard.org/sites/default/files/2016-trends-college-pricing-web_1.pdf.
[48] Spiros Protopsaltis and Sharon Parrott, “Pell Grants — a Key Tool for Expanding College Access and Economic Opportunity — Need Strengthening, Not Cuts,” Center on Budget and Policy Priorities, July 27, 2017, https://www.cbpp.org/research/federal-budget/pell-grants-a-key-tool-for-expanding-college-access-and-economic-opportunity.
[49] “45th Annual Survey Report on State-Sponsored Student Financial Aid,” National Association of State Student Grant and Aid Programs, 2016, https://www.nassgap.org/viewrepository.aspx?categoryID=3#collapse_421.
[50] College Board, “Trends in Student Aid 2016,” October 2016, Figure 28A, https://trends.collegeboard.org/sites/default/files/2016-trends-student-aid_0.pdf.
[51] “45th Annual Survey Report on State-Sponsored Student Financial Aid,” National Association of State Student Grant and Aid Programs, 2016, https://www.nassgap.org/viewrepository.aspx?categoryID=3#collapse_421.
[52] Donald Heller and Patricia Marin, eds., “State Merit Scholarship Programs and Racial Inequality,” Cambridge, MA: The Civil Rights Project at Harvard University, 2004, https://www.nmefoundation.org/getmedia/78d0251f-ee9d-4410-9645-ac16392be40c/heller-marin-state-merit-scholarship-2004.
[53] Liang Zhang and Erik C. Ness, “Does State Merit-Based Aid Stem Brain Drain?”, Educational Evaluation and Policy Analysis, Vol. 32, No. 2, (June 2010), pp 143-165, https://www.jstor.org/stable/40732415?seq=1#page_scan_tab_contents
[54] Eric Bettinger, “How Financial Aid Affects Persistence,” National Bureau of Economic Research, January 2004, http://www.nber.org/papers/w10242.
[55] College Board, “Net Tuition and Fees, Net Room and Board and Other Costs, and Total Grant Aid in 2011 Dollars by Family Income, Full-Time Dependent Students at Public Institutions, 1999-2000, 2003-04, 2007-08, and 2011-12,” Figure 2013_12, October 2014, http://trends.collegeboard.org/sites/default/files/trends-college-pricing-web-final-508-2.pdf.
[56] College Board, “Trends in Student Aid, 2015: Median Debt Levels of 2007-08 Bachelor’s Degree Recipients by Income Level,” October 2015, 2014_14b, http://trends.collegeboard.org/sites/default/files/trends-student-aid-web-final-508-2.pdf. Low-income dependent students are defined as students from families earning less than $30,000 annually, while high-income students come from families earning more than $106,000.
[57] Mark Huelsman, “The Debt Divide: The Racial and Class Bias Behind the ‘New Normal’ of Student Borrowing,” May 2015, http://www.demos.org/sites/default/files/publications/Mark-Debt%20divide%20Final%20(SF).pdf. Hispanic or Latino students generally borrow at levels equal to the national average. African American students are also more likely to take on student debt to finance education at two-year colleges.
[58] College Board “Trends in Student Aid 2015,” Figure 15, October 2015, http://trends.collegeboard.org/sites/default/files/trends-student-aid-web-final-508-2.pdf, and College Board, “Trends in Student Aid 2016,” Figure 13, October 2016, https://trends.collegeboard.org/sites/default/files/2016-trends-student-aid_0.pdf.
[59] Federal Reserve Bank of New York, “Quarterly Report on Household Debt and Credit,” May 2017, https://www.newyorkfed.org/medialibrary/interactives/householdcredit/data/pdf/HHDC_2017Q1.pdf
[60]Adam Looney and Constantine Yannelis, “A Crisis in Student Loans? How Changes in the Characteristics of Borrowers and in the Institutions They Attended Contributed to Rising Loan Defaults,” Brookings Institution, BPEA Conference Draft, September 10, 2015, http://www.brookings.edu/~/media/projects/bpea/fall-2015_embargoed/conferencedraft_looneyyannelis_studentloandefaults.pdf.
[61] See, for example, Kent Hill et al., “The Value of Higher Education: Individual and Societal Benefits,” October 2005, http://www.asu.edu/president/p3/Reports/EdValue.pdf and College Board, “Education Pays 2013,” October 2013, http://trends.collegeboard.org/sites/default/files/education-pays-2013-full-report-022714.pdf for summaries of the social benefits of higher levels of educational attainment.
[62] Enrico Moretti, “Estimating the Social Return to Higher Education: Evidence from Longitudinal and Repeated Cross-Sectional Data,” Journal of Econometrics, Vol. 121, 2004, pp. 175-212.
[63] See Carnevale, Smith, and Strohl.
[64] Ibid.
[65] Beth Akers, “Higher education debt is worth it, but isn’t risk free,” Brookings Institution, January 12, 2016, http://www.brookings.edu/research/opinions/2016/01/12-higher-education-debt-akers.
[66] For impacts of debt on homeownership, see Jennifer M. Shand, “The Impact of Early-Life Debt on the Homeownership Rates of Young Households: An Empirical Investigation,” Federal Deposit Insurance Corporation, November 2007. For the relationship between debt and graduation, see for example, Rachel E. Dwyer, Laura McCloud, and Randy Hodson, “Debt and Graduation from American Universities,” Social Forces, June 15, 2012, http://sf.oxfordjournals.org/content/90/4/1133. For information on graduate enrollment, see for example Lindsey E. Malcolm and Alicia C. Dowd, “The Impact of Undergraduate Debt on the Graduate School Enrollment of STEM Baccalaureates,” Review of Higher Education, Volume 35, No. 2, Winter 2012, pp. 265-305.
[67] Brent W. Ambrose, Larry Cordell, and Shuwei Ma, “The Impact of Student Loan Debt on Small Business Formation,” March 29, 2014, http://dx.doi.org/10.2139/ssrn.2417676.
[68] McNichol and Waxman.
[69] Iris Lav and Michael Leachman, “The Trump Budget’s Massive Cuts to State and Local Services and Programs,” Center on Budget and Policy Priorities, June 13 2017, https://www.cbpp.org/research/state-budget-and-tax/the-trump-budgets-massive-cuts-to-state-and-local-services-and.
[70] Michael Leachman et al., “Most States Have Cut School Funding, and Some Continue Cutting,” Center on Budget and Policy Priorities, January 25, 2016, https://www.cbpp.org/research/state-budget-and-tax/most-states-have-cut-school-funding-and-some-continue-cutting.
[71] Elizabeth McNichol, “It’s Time for States to Invest in Infrastructure,” Center on Budget and Policy Priorities, updated August 10, 2017, https://www.cbpp.org/research/state-budget-and-tax/its-time-for-states-to-invest-in-infrastructure.
[72] Data from the National Association of State Budget Officers.
[73] Nicholas Johnson and Michael Leachman, “Four Big Threats to State Finances Could Undermine Future U.S. Prosperity,” Center on Budget and Policy Priorities, February 14, 2013, https://www.cbpp.org/research/four-big-threats-to-state-finances-could-undermine-future-us-prosperity.
More from the Authors
Areas of Expertise