Health Insurance Costs Will Rise Steeply if Premium Tax Credit Improvements Expire
Improvements to premium tax credits, enacted in the American Rescue Plan and extended by the Inflation Reduction Act, have helped millions of people afford health coverage in the Affordable Care Act (ACA) marketplaces. But the enhanced premium tax credits are set to expire after 2025. If Congress does not act, nearly all marketplace enrollees will face significantly higher premium costs and 3.8 million will become uninsured, according to Congressional Budget Office estimates.
Premium Tax Credit Improvements Save $700 on Average
A record 92 percent of marketplace enrollees, or 19.7 million people, qualified for premium tax credits (PTCs) in 2024.[1] These tax credits provide up-front financial assistance to help people afford the individual or family health insurance plans offered in their state through the ACA marketplaces.[2]
The PTC enhancements helped these enrollees by:
- lowering the caps on premium contributions for people of all income levels;
- allowing people with incomes between 100 and 150 percent of the poverty level to pay $0 in premiums for “benchmark” silver-level plans; and
- extending eligibility for PTCs to people with incomes above 400 percent of the poverty level if their benchmark premiums would exceed 8.5 percent of household income.
The average enrollee saved an estimated $700 in 2024 because of the PTC enhancements. Average monthly premiums were 32 percent lower than in 2021, before the enhancements took effect.[3]
Improvements Spurred Record Coverage, Especially Among Black and Latino People
By making health insurance more affordable, the PTC enhancements helped drive a record 21.4 million people to sign up for marketplace coverage in 2024. This is nearly twice as many as in 2021, when only 12 million people enrolled.[4] (See Figure 1.)

The PTC enhancements have been especially critical for increasing enrollment among Black and Latino people. People of color made up the majority of marketplace enrollees for the first time in 2023. Between 2021 and 2023, marketplace enrollment among Black and Latino people each grew by over 80 percent, far outpacing the growth rates for other racial and ethnic groups.[5] Marketplace enrollment rates of Asian American people have long been higher than other racial and ethnic groups, potentially due to robust and language-specific enrollment assistance among non-profits and insurance brokers.[6]
The enhancements also helped spur enrollment among people with lower incomes — those just above the minimum income level for PTC eligibility. Between 2021 and 2024, marketplace enrollment among people with incomes between 100 and 200 percent of the federal poverty level more than doubled, with enrollment growing by 109 percent compared to 46 percent among those with other incomes.[7]
Many of these coverage gains will be lost if PTC enhancements are allowed to lapse. If the enhancements are not made permanent and instead are allowed to expire, the Congressional Budget Office projects that 3.8 million more people would be uninsured.[8]
If Improvements Expire, Premiums Will Rise in Every State for People of All Ages and Income Levels
If PTC enhancements expire, premium costs will increase for people across states, ages, and income levels. The initial impact would occur in the spring and summer of 2025, as insurers begin making premium rates public, and would intensify in the fall of 2025 when people begin shopping for 2026 plans. Among those with lower incomes who would see their subsidies reduced, for example:
- A single individual making $21,000 (144 percent of the poverty level) would no longer be eligible for a zero-premium plan and would see their monthly marketplace premium rise from $0 to $66 — an annual increase of $792.
- A single individual making $30,000 (205 percent of the poverty level) would see their monthly marketplace premium more than double, from $55 to $168 — an annual increase of $1,350.
- A 60-year-old couple making $45,000 (228 percent of the poverty level) would see monthly marketplace premiums increase from $117 to $283 — an annual increase of almost $2,000.
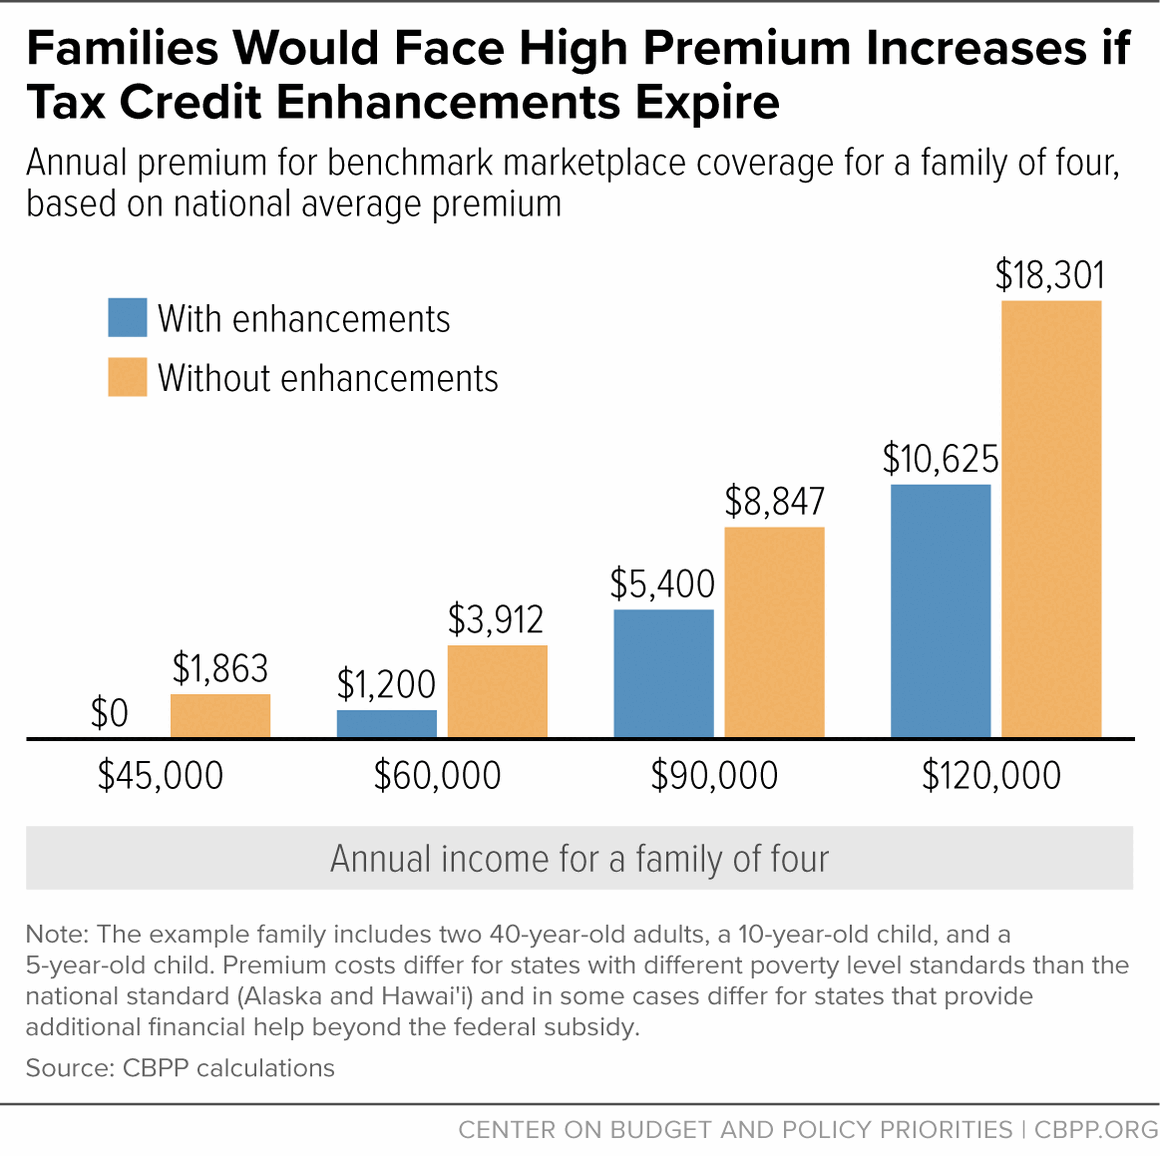
- A family of four making $60,000 (200 percent of the poverty level) would see their monthly marketplace premium increase from $100 to $326 — an annual increase of about $2,700. (See Figure 2 for a family of four at different income levels; Appendix Table 1 for premium increases among people of various family sizes, ages, and incomes; and Appendix Table 2 for premium increases at the state level.)
As a result of the enhancements, people with incomes above 400 percent of the federal poverty level became newly eligible for PTCs if their marketplace premiums would exceed 8.5 percent of household income. If the PTC enhancements are not extended, the premium increases for people in this group would be dramatic:
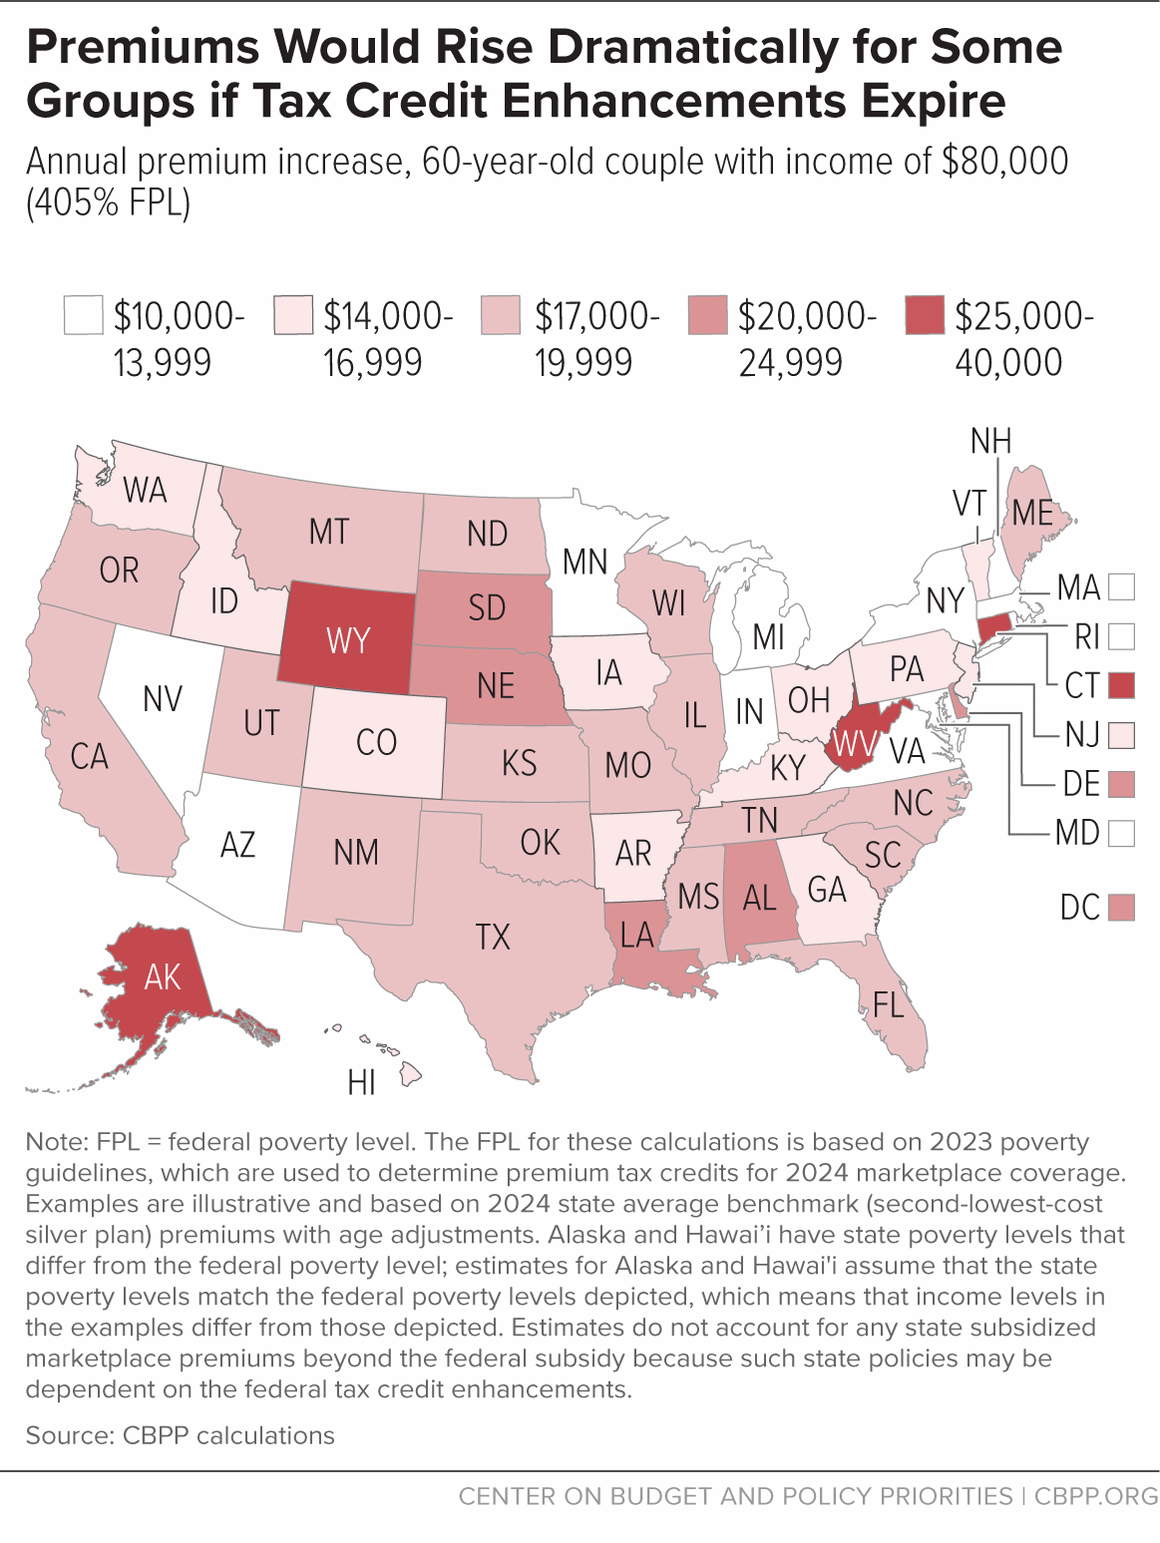
- A typical 60-year-old couple making $80,000 (405 percent of the poverty level) would see monthly marketplace premiums more than triple, from $567 to $2,026 — an annual increase of roughly $17,500.
- A typical family of four making $125,000 (416 percent of the poverty level) would see their monthly marketplace premium increase from $885 to $1,525 — an annual increase of about $7,700.
Premiums would rise the most:
- in states with high underlying marketplace premiums, such as West Virginia and Wyoming;
- for older enrollees, who pay higher premiums under ACA rules than younger people; and
- for people with incomes above 400 percent of the poverty level, who would lose subsidies entirely if the enhancements expired.
For example, a 60-year-old West Virginia couple making $80,000 would see annual premiums for a benchmark silver plan increase more than sixfold, from $6,800 to over $43,000. (See Figure 3 and Appendix Table 2).
Appendix
| APPENDIX TABLE 1 | ||||
|---|---|---|---|---|
| National Average Premium Increases if Enhancements Expire, by Income Level | ||||
| Annual marketplace premiums | ||||
| With enhancements (current) | Without enhancements | Premium increase without enhancements | Percentage premium increase | |
| 45-year-old individual | ||||
| $21,000 (144% FPL) | $0 | $792 | $792 | N/A |
| $30,000 (205% FPL) | $660 | $2,010 | $1,350 | 205% |
| $45,000 (308% FPL) | $2,790 | $4,424 | $1,634 | 59% |
| $60,000 (411% FPL) | $5,100 | $6,467 | $1,367 | 27% |
| 60-year-old couple | ||||
| $29,000 (147% FPL) | $0 | $1,147 | $1,147 | N/A |
| $45,000 (228% FPL) | $1,404 | $3,390 | $1,986 | 141% |
| $60,000 (304% FPL) | $3,660 | $5,898 | $2,238 | 61% |
| $80,000 (405% FPL) | $6,800 | $24,311 | $17,511 | 258% |
| Family of four | ||||
| $45,000 (150% FPL) | $0 | $1,863 | $1,863 | N/A |
| $60,000 (200% FPL) | $1,200 | $3,912 | $2,712 | 226% |
| $90,000 (300% FPL) | $5,400 | $8,847 | $3,447 | 64% |
| $125,000 (416% FPL) | $10,625 | $18,301 | $7,676 | 72% |
| APPENDIX TABLE 2 | |||||||||
|---|---|---|---|---|---|---|---|---|---|
| State-by-State Premium Increases if Enhancements Expire | |||||||||
| 45-year-old individual; $60,000 (411% FPL) | 60-year-old couple; $80,000 (405% FPL) | Family of four; $125,000 (416% FPL) | |||||||
| State | With enhance-ments (current) | Without enhancements | Premium increase without enhancements | With enhancements (current) | Without enhancements | Premium increase without enhancements | With enhance-ments (current) | Without enhancements | Premium increase without enhancements |
| U.S. average | $5,100 | $6,467 | $1,367 | $6,800 | $24,311 | $17,511 | $10,625 | $18,301 | $7,676 |
| Alabama | 5,100 | 7,647 | 2,547 | 6,800 | 28,745 | 21,945 | 10,625 | 20,262 | 9,637 |
| Alaska | 6,362 | 12,054 | 5,692 | 8,482 | 45,310 | 36,828 | 13,260 | 34,108 | 20,848 |
| Arizona | 5,100 | 5,464 | 364 | 6,800 | 20,540 | 13,740 | 10,625 | 15,462 | 4,837 |
| Arkansas | 5,100 | 5,749 | 649 | 6,800 | 21,610 | 14,810 | 10,625 | 16,267 | 5,642 |
| California | 5,100 | 6,345 | 1,245 | 6,800 | 23,853 | 17,053 | 10,625 | 17,955 | 7,330 |
| Colorado | 5,100 | 6,115 | 1,015 | 6,800 | 22,986 | 16,186 | 10,625 | 17,303 | 6,678 |
| Connecticut | 5,100 | 8,962 | 3,862 | 6,800 | 33,689 | 26,889 | 10,625 | 25,360 | 14,735 |
| Delaware | 5,100 | 7,227 | 2,127 | 6,800 | 27,165 | 20,365 | 10,625 | 20,449 | 9,824 |
| District of Columbia | 5,100 | 7,733 | 2,633 | 6,800 | 27,487 | 20,687 | 10,625 | 21,332 | 10,707 |
| Florida | 5,100 | 6,630 | 1,530 | 6,800 | 24,923 | 18,123 | 10,625 | 18,761 | 8,136 |
| Georgia | 5,100 | 6,278 | 1,178 | 6,800 | 23,598 | 16,798 | 10,625 | 17,764 | 7,139 |
| Hawai'i | 5,859 | 6,345 | 486 | 7,808 | 23,853 | 16,045 | 12,199 | 17,955 | 5,756 |
| Idaho | 5,100 | 5,654 | 554 | 6,800 | 21,253 | 14,453 | 10,625 | 15,999 | 5,374 |
| Illinois | 5,100 | 6,413 | 1,313 | 6,800 | 24,107 | 17,307 | 10,625 | 18,147 | 7,522 |
| Indiana | 5,100 | 5,410 | 310 | 6,800 | 20,336 | 13,536 | 10,625 | 15,308 | 4,683 |
| Iowa | 5,100 | 6,115 | 1,015 | 6,800 | 22,986 | 16,186 | 10,625 | 17,303 | 6,678 |
| Kansas | 5,100 | 6,590 | 1,490 | 6,800 | 24,770 | 17,970 | 10,625 | 18,646 | 8,021 |
| Kentucky | 5,100 | 5,844 | 744 | 6,800 | 21,967 | 15,167 | 10,625 | 16,536 | 5,911 |
| Louisiana | 5,100 | 7,634 | 2,534 | 6,800 | 28,694 | 21,894 | 10,625 | 21,600 | 10,975 |
| Maine | 5,100 | 6,983 | 1,883 | 6,800 | 26,248 | 19,448 | 10,625 | 19,759 | 9,134 |
| Maryland | 4,691 | 4,691 | 0 | 6,800 | 17,635 | 10,835 | 10,625 | 13,275 | 2,650 |
| Massachusetts | 5,100 | 5,454 | 354 | 6,800 | 17,073 | 10,273 | 10,625 | 15,477 | 4,852 |
| Michigan | 5,100 | 5,166 | 66 | 6,800 | 19,418 | 12,618 | 10,625 | 14,618 | 3,993 |
| Minnesota | 4,651 | 4,651 | 0 | 6,800 | 17,482 | 10,682 | 10,625 | 13,965 | 3,340 |
| Mississippi | 5,100 | 6,576 | 1,476 | 6,800 | 24,719 | 17,919 | 10,625 | 17,424 | 6,799 |
| Missouri | 5,100 | 6,793 | 1,693 | 6,800 | 25,535 | 18,735 | 10,625 | 19,221 | 8,596 |
| Montana | 5,100 | 6,834 | 1,734 | 6,800 | 25,687 | 18,887 | 10,625 | 19,337 | 8,712 |
| Nebraska | 5,100 | 7,728 | 2,628 | 6,800 | 29,051 | 22,251 | 10,625 | 21,869 | 11,244 |
| Nevada | 5,100 | 5,247 | 147 | 6,800 | 19,724 | 12,924 | 10,625 | 14,848 | 4,223 |
| New Hampshire | 4,542 | 4,542 | 0 | 6,800 | 17,074 | 10,274 | 10,625 | 12,853 | 2,228 |
| New Jersey | 5,100 | 6,251 | 1,151 | 6,800 | 23,496 | 16,696 | 10,625 | 17,687 | 7,062 |
| New Mexico | 5,100 | 6,386 | 1,286 | 6,800 | 24,006 | 17,206 | 10,625 | 18,070 | 7,445 |
| New York | 5,100 | 8,832 | 3,732 | 6,800 | 17,664 | 10,864 | 10,625 | 25,171 | 14,546 |
| North Carolina | 5,100 | 6,712 | 1,612 | 6,800 | 25,229 | 18,429 | 10,625 | 18,991 | 8,366 |
| North Dakota | 5,100 | 6,590 | 1,490 | 6,800 | 24,770 | 17,970 | 10,625 | 18,646 | 8,021 |
| Ohio | 5,100 | 5,898 | 798 | 6,800 | 22,171 | 15,371 | 10,625 | 16,689 | 6,064 |
| Oklahoma | 5,100 | 6,888 | 1,788 | 6,800 | 25,891 | 19,091 | 10,625 | 19,490 | 8,865 |
| Oregon | 5,100 | 6,617 | 1,517 | 6,800 | 24,872 | 18,072 | 10,625 | 17,531 | 6,906 |
| Pennsylvania | 5,100 | 6,034 | 934 | 6,800 | 22,680 | 15,880 | 10,625 | 17,073 | 6,448 |
| Rhode Island | 5,100 | 5,423 | 323 | 6,800 | 20,387 | 13,587 | 10,625 | 15,346 | 4,721 |
| South Carolina | 5,100 | 6,671 | 1,571 | 6,800 | 25,076 | 18,276 | 10,625 | 18,876 | 8,251 |
| South Dakota | 5,100 | 8,352 | 3,252 | 6,800 | 31,396 | 24,596 | 10,625 | 23,634 | 13,009 |
| Tennessee | 5,100 | 6,793 | 1,693 | 6,800 | 25,535 | 18,735 | 10,625 | 19,221 | 8,596 |
| Texas | 5,100 | 6,440 | 1,340 | 6,800 | 24,209 | 17,409 | 10,625 | 18,224 | 7,599 |
| Utah | 5,100 | 7,191 | 2,091 | 6,800 | 24,682 | 17,882 | 10,625 | 18,692 | 8,067 |
| Vermont | 5,100 | 11,400 | 6,300 | 6,800 | 22,800 | 16,000 | 10,625 | 32,034 | 21,409 |
| Virginia | 5,030 | 5,030 | 0 | 6,800 | 18,909 | 12,109 | 10,625 | 14,234 | 3,609 |
| Washington | 5,100 | 5,627 | 527 | 6,800 | 21,151 | 14,351 | 10,625 | 15,922 | 5,297 |
| West Virginia | 5,100 | 11,484 | 6,384 | 6,800 | 43,169 | 36,369 | 10,625 | 32,496 | 21,871 |
| Wisconsin | 5,100 | 6,454 | 1,354 | 6,800 | 24,260 | 17,460 | 10,625 | 18,262 | 7,637 |
| Wyoming | 5,100 | 11,132 | 6,032 | 6,800 | 41,844 | 35,044 | 10,625 | 31,499 | 20,874 |
End Notes
[1] Centers for Medicare & Medicaid Services (CMS), 2024 Marketplace Open Enrollment Period Public Use Files, https://www.cms.gov/data-research/statistics-trends-reports/marketplace-products/2024-marketplace-open-enrollment-period-public-use-files.
[2] CBPP, Beyond the Basics, “Key Facts: Premium Tax Credit”, updated August 2023, https://www.healthreformbeyondthebasics.org/premium-tax-credits-answers-to-frequently-asked-questions/
[3] CMS, “Health Insurance Marketplaces 2024 Open Enrollment Report,” March 22, 2024, https://www.cms.gov/data-research/statistics-trends-reports/marketplace-products/2024-marketplace-open-enrollment-period-public-use-files
[4] Ibid.
[5] Nearly half of enrollees’ races and ethnicities were unknown in 2024 marketplace enrollment data. The estimates cited here are limited to states that use the HealthCare.gov platform and include imputations of missing race and ethnicity data, which greatly improves the usefulness of the data but does not disaggregate beyond broad racial and ethnic categories. Anupama Warrier et al., “HealthCare.gov Enrollment by Race and Ethnicity, 2015-2023,” Office of the Assistant Secretary for Planning and Evaluation, HHS, March 22, 2024, https://aspe.hhs.gov/reports/marketplace-enrollment-race-ethnicity-2015-2023.
[6] CBPP analysis of American Community Survey. Rose Chu and Benjamin Sommers, “Health Insurance Coverage Changes Since Implementation of the Affordable Care Act: Asian Americans and Pacific Islanders,” Office of the Assistant Secretary for Planning and Evaluation, HHS, May 2021, https://aspe.hhs.gov/reports/health-insurance-coverage-changes-asian-americans-pacific-islanders.
[7] CMS, “Marketplace Open Enrollment Period Public Use Files,” March 22, 2024, https://www.cms.gov/data-research/statistics-trends-reports/marketplace-products/2024-marketplace-open-enrollment-period-public-use-files.
[8] Congressional Budget Office, “Budgetary Outcomes Under Alternative Assumptions About Spending and Revenues,” May 8, 2024, https://www.cbo.gov/publication/60114.
More from the Authors