Expiration of Pandemic Relief Led to Record Increases in Poverty and Child Poverty in 2022
Overall poverty and child poverty rose in 2022 by the largest amounts on record in data back to 1967, a sharp retreat from the historic progress made during the COVID-19 pandemic:
- In 2021, bolstered by federal pandemic relief, economic security programs drove the poverty rate down to a record low of 8.0 percent. The expiration of that aid drove poverty back up in 2022, to 12.4 percent. The number of people living in poverty fell by 14.5 million between 2019 and 2021 and rose back up by 14.5 million in 2022.
- The American Rescue Plan’s Child Tax Credit expansion and stimulus payments, in conjunction with other relief measures, spurred the largest one-year drop in child poverty on record in 2021. In 2022, the expiration of that aid led to a historic increase in child poverty. (See Figure 1.) As a result, 5 million more children lived in poverty in 2022 compared to 2021.
The significant backsliding on child poverty that occurred after Congress allowed the Child Tax Credit expansion to expire underscores the fact that the number of children living in poverty is a policy choice. Recently there have been encouraging signs of bipartisan interest in a modest expansion. On January 31, 2024, in a strong bipartisan vote, the House passed a tax bill that included a Child Tax Credit expansion that, while far smaller than the Rescue Plan expansion, would help about 16 million children and lift a half million or more children above the poverty line in 2025.[1] Unfortunately, the legislation has been stuck in the Senate.
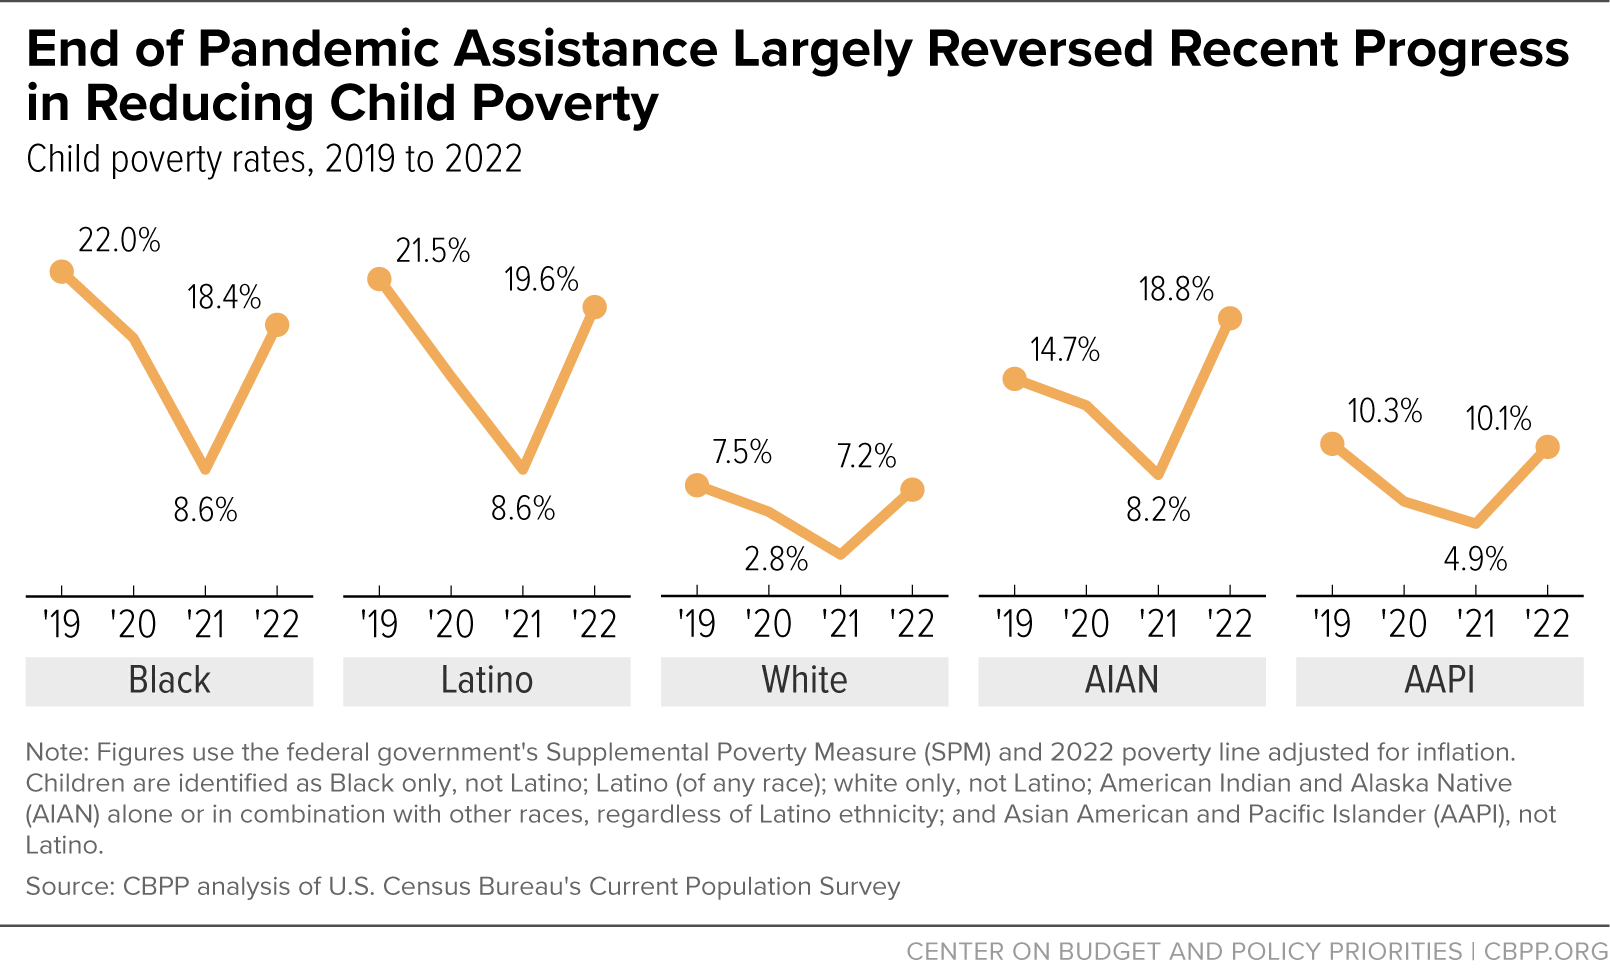
Pandemic relief policies helped reduce racial and ethnic inequities in child poverty to their lowest level ever in 2021, but the expiration of those policies reopened gaps in 2022 nearly to pre-pandemic levels. These substantial shifts demonstrate the ability of economic assistance like the Child Tax Credit to promote well-being for children and families of color in the face of glaring inequities that have arisen due to discrimination and governmental underinvestment, which have limited opportunity in systemic ways.

The above findings emerge from our analysis of the Census Bureau’s Current Population Survey (CPS) data and historical Supplemental Poverty Measure (SPM) data produced by Columbia University’s Center on Poverty and Social Policy.[2] We use the Census Bureau’s SPM data when available (for 2009 through 2022) and the Columbia SPM data for prior years. We create an “anchored” series by using the 2022 SPM poverty line adjusted for inflation.[3] Unlike the official poverty measure, the SPM counts income from non-cash programs such as the Supplemental Nutrition Assistance Program (SNAP, formerly known as the Food Stamp Program) and rental assistance, and from refundable tax credits for families with low or moderate incomes — the Earned Income Tax Credit (EITC) and Child Tax Credit — as well as cash benefits such as Social Security and unemployment insurance.
COVID Relief Achieved Historic Gains Against Poverty and Child Poverty
Government policies produced historic reductions in poverty in both 2020 and 2021, building on a longer-term trend of government assistance becoming more effective at reducing poverty. In 1967, the first year for which these data are available, economic security programs lowered the number of people in poverty by less than 1 percent. In 2020 and 2021, strengthened by pandemic relief measures, economic security programs reduced poverty by all-time highs of 63 percent and 67 percent, respectively.[4] (Put another way, in 2021 the number of people below the poverty line was 67 percent smaller after counting economic security programs than before counting them.)
Those years also set records using other measures of poverty reduction. In 2020 and 2021, economic security programs reduced the poverty rate by 16.1 and 16.0 percentage points, respectively, surpassing the prior record of 13.0 percentage points in 2009. In addition, economic security programs kept record numbers of people above the poverty line in 2020 and 2021: 53 million in each year, far exceeding the previous high of 40 million in 2009.
Due to changes in the Census Bureau’s survey methods, data after 2017 are not strictly comparable to earlier years.[5] But the Census Bureau provides enough data about this survey transition to make clear that the anti-poverty effectiveness of economic security programs reached all-time highs in 2020 and 2021 by our measure (the SPM with an inflation-adjusted poverty line), and the SPM poverty rate reached record lows.[6]

The historic poverty reduction in 2020 and 2021 was driven by four major legislative packages enacted in those years that provided stimulus payments, expanded unemployment insurance, increased nutrition and housing assistance, improved tax credits, and made health coverage more accessible. The three policies that reduced poverty the most, as measured by the SPM, were stimulus payments (formally known as Economic Impact Payments), expansions in unemployment insurance, and the expansion of the Child Tax Credit.[7] All three were temporary and were no longer in effect by 2022.
In 2022, the expiration of the American Rescue Plan’s expanded Child Tax Credit and the end of the stimulus payments helped drive up the SPM poverty rate from 8.0 percent to 12.4 percent, an increase of 14.5 million people. (See Figure 2.) This 4.4 percentage point increase was by far the largest single-year increase on record, although the rate remained low by pre-pandemic standards. The 2022 rate is statistically indistinguishable from the 2019 rate of 12.6 percent, a record low at the time and well below 1967’s rate of 28.5 percent. In 2022, economic security programs lowered the number of people in poverty by 48 percent, from 78 million to 41 million. (As noted, the comparable figure for 2021 was 67 percent.)
Government Assistance the Main Driver of Changes in Poverty
Both the recent swings in poverty and poverty’s longer-term decline have been driven much more by changes in government income assistance than by changes in the private economy. Before considering government assistance and taxes, poverty has improved only modestly over the past five decades, falling from 28.5 percent to 23.7 percent between 1967 and 2022. After government assistance and taxes are considered, the decline has been far larger: from 28.5 percent to 12.4 percent. (See Figure 3.)

Government Programs Produced Dramatic Gains in Child Poverty
The impact of government poverty-reduction efforts has been just as striking among children, a particularly important development given child poverty’s long-lasting consequences and the health and economic benefits of reducing child poverty.[8]
In the late 1960s, assistance programs were fewer and weaker and a substantial number of families with children were taxed into poverty, making child poverty modestly higher than it would have been without accounting for taxes and government benefits. In 2020 and 2021, in contrast, taxes and government benefits — bolstered by pandemic relief legislation — cut child poverty by 59 percent and 76 percent, respectively, both all-time highs in data back to 1967. In 2022, due to the expiration of pandemic relief, taxes and government benefits cut child poverty by a smaller though still sizeable 41 percent, dropping the child poverty rate from 20.9 percent to 12.4 percent. (See Figure 4.)

By lowering child poverty, economic security programs can yield lasting benefits. As a congressionally chartered report from the National Academy of Sciences concluded: “The weight of the causal evidence indicates that income poverty itself causes negative child outcomes. . . . Many programs that alleviate poverty either directly, by providing income transfers, or indirectly, by providing food, housing, or medical care, have been shown to improve child well-being.”[9]
Recent studies of nutrition assistance and the EITC, for example, have found evidence that children whose families receive assistance earn more as young adults.[10] Other studies have linked income assistance programs with healthier birthweights, lower stress for mothers (measured by reduced stress hormone levels in the women’s bloodstream), better nutrition in childhood, higher scores on reading and math tests and other measures of school performance, more high school completion, higher rates of college entry, and better health in adulthood.[11]
Pandemic Legislation Reduced Poverty, Inequity Across Racial and Ethnic Groups
In 2020 and 2021, bolstered by economic recovery legislation, economic security programs produced record reductions in poverty for Black, Latino, and white people (in data back to 1970) as well as for American Indian and Alaska Native (AIAN) people and Asian American and Pacific Islander (AAPI) people (in data back to 1987).[12]
Black, AIAN, and Latino people entered the pandemic with lower incomes, due in part to the accumulated effects of past and ongoing discrimination in employment, under-resourced schools, and other structural barriers to opportunity. Because larger shares were below the poverty line, larger shares were lifted above the poverty line by broadly distributed pandemic relief policies such as stimulus payments. Further, elements of the pandemic response that targeted communities with the greatest need had particularly widespread reach in Black, AIAN, and Latino communities. Income from economic security programs bolstered by pandemic relief kept some 23 percent of Black and AIAN people, 18 percent of Latino people, 14 percent of white people, and 10 percent of AAPI people above the poverty line in 2021.[13]
The American Rescue Plan’s Child Tax Credit expansion, in effect only in 2021, not only reduced poverty for all children, but also helped narrow racial and ethnic inequities in child poverty. In 2021, the poverty rates for Black, Latino, and AIAN children exceeded those for white children by 6, 6, and 5 percentage points, respectively — the narrowest such differences on record.[14] Prior to the pandemic, the poverty rates for both Black and Latino children were always at least 13 percentage points above the rate for white children.
In 2022, though, the expiration of pandemic assistance drove the poverty rate for Black children up to a level 11 percentage points higher than for white children. For Latino and AIAN children, it was 12 percentage points higher. Thus, the loss of pandemic assistance largely reversed recent progress both in reducing child poverty within racial and ethnic groups and in narrowing percentage point differences in poverty across those groups. (See Figure 5.)[15]
After Congress allowed the Child Tax Credit expansion to expire, the credit reverted to a smaller and less equitable design that denies full participation to families with low or no earnings. As a result, in 2022 an estimated 46 percent of Black children, 39 percent of AIAN children, 37 percent of Latino children, 17 percent of white children, and 15 percent of Asian children received less than the full credit or no credit at all because their family incomes were too low.[16]
Making the Child Tax Credit fully available to the children who need it most would lower the number of children experiencing poverty, push back against long-standing inequities, and enable more families to offer their children a stronger foundation of income security and opportunity.
Recent Decades Show Economic Security Programs Reduce Poverty, and Narrow Racial-Ethnic Inequities for Children
Although recent progress in reducing racial inequities in poverty was largely reversed in 2022 due to the expiration of pandemic policies, racial inequities that year were much smaller than they were 50 years ago. In 1970, the poverty rates for Black and Latino children exceeded those for white children by 39 and 36 percentage points, respectively. In 2022, as noted above, these differences were 11 and 12 percentage points, respectively.
Looking back over the last half-century, economic security programs such as Social Security, food assistance, refundable tax credits, and housing assistance have reduced poverty for millions of people. They have also reduced key measures of racial and ethnic inequity in children’s exposure to poverty, with lasting consequences for their lifelong prospects to flourish. Yet economic barriers and the effects of structural racism — including past and ongoing discrimination and other obstacles to employment, education, and health care — remain large, keeping poverty rates much higher for some racial and ethnic groups than others.[17]
Between 1970 and 2022, the poverty rate fell for all groups, but it fell more for Black and Latino people (by 33 and 28 percentage points, respectively) than for white people (9 percentage points), we calculate. Even with this reduction, the poverty rates for Black (17.2 percent) and Latino (19.3 percent) people in 2022 remained far above the white poverty rate (9.2 percent).
Stronger economic security programs deserve much of the credit. In 1970, families’ government benefits and the taxes they paid lowered the white and Black poverty rates by about 2 percentage points each and raised the Latino poverty rate by 3 percentage points. In 2022, in contrast, government benefits and taxes lowered the Black poverty rate by more than 14 percentage points, white poverty by some 12 percentage points, and Latino poverty by some 10 percentage points. (See Figure 6.)
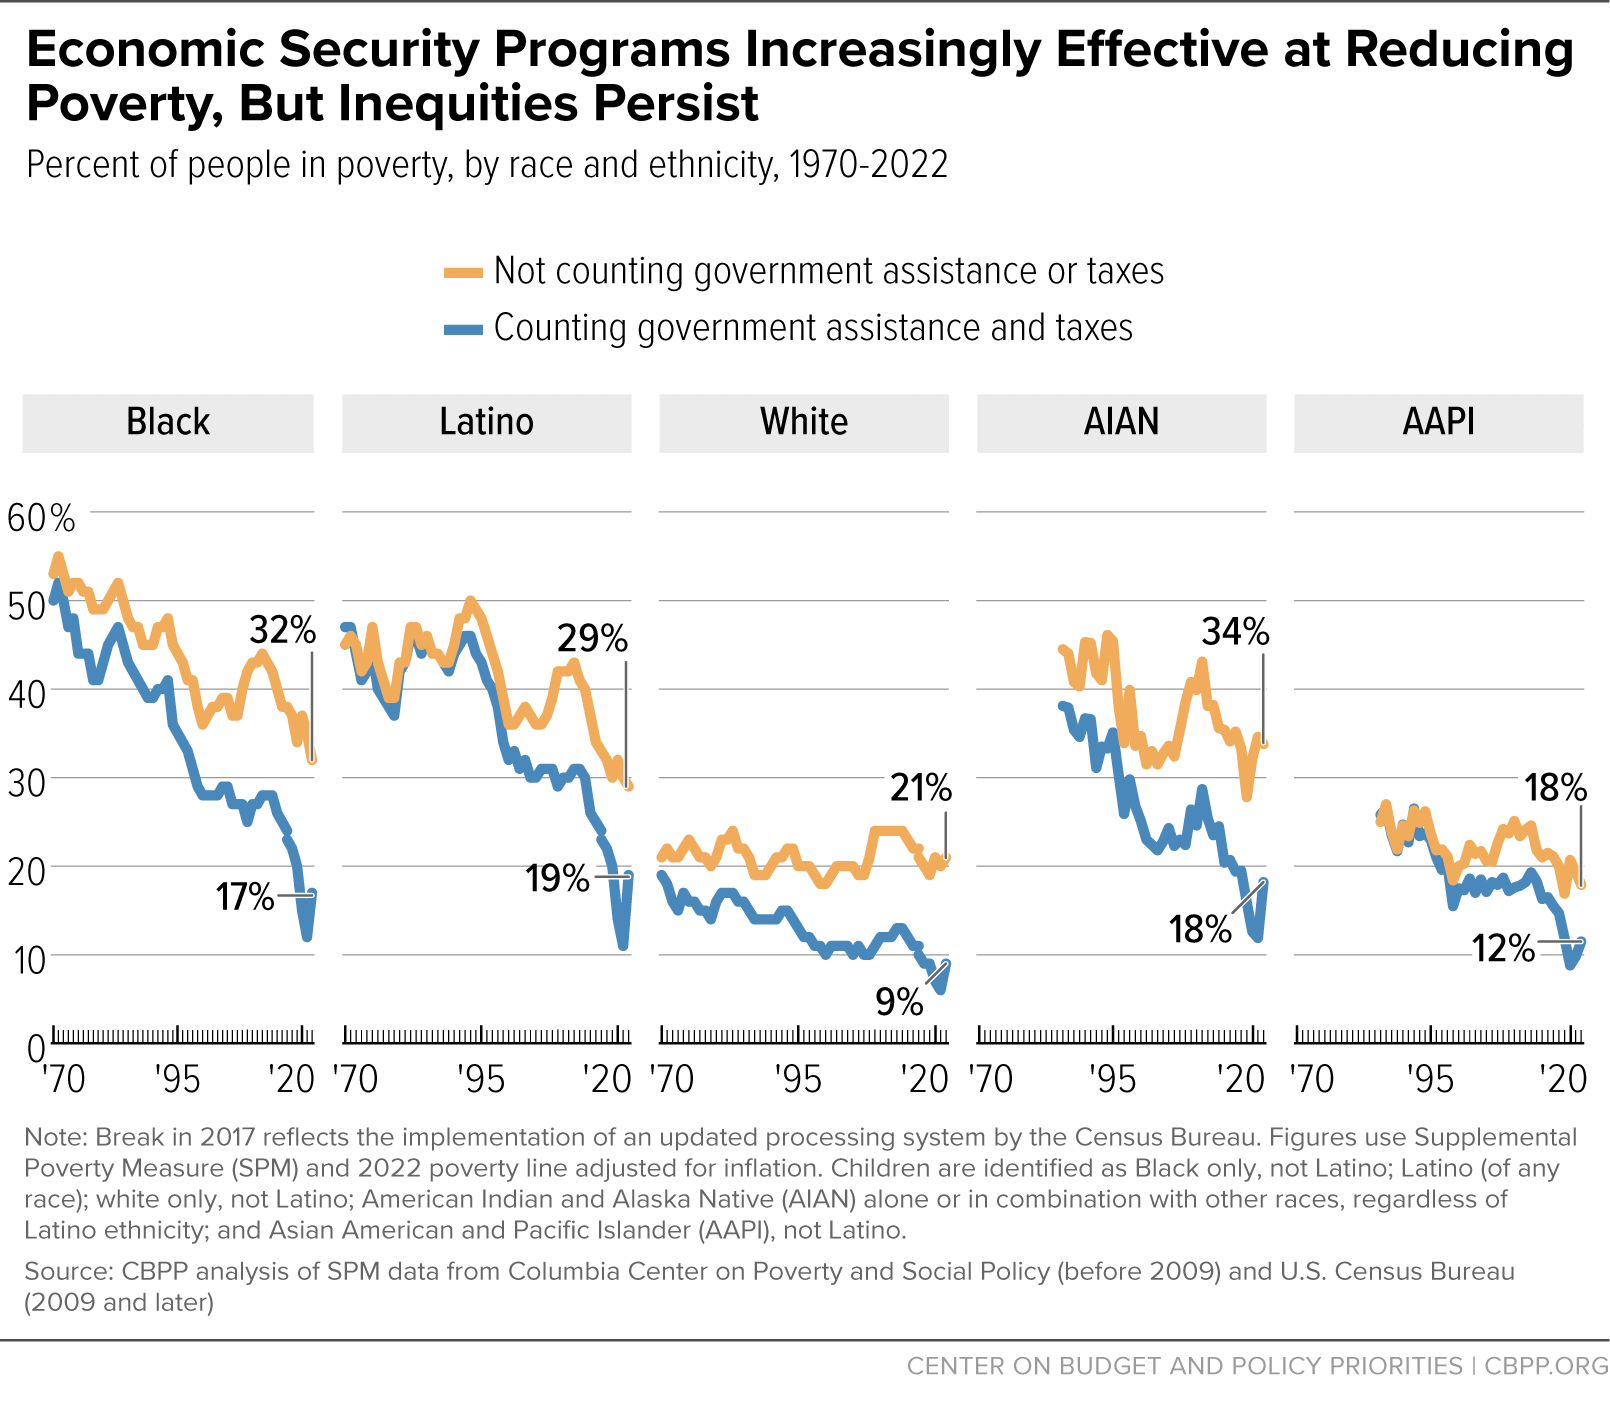
Between 1987 (the first year these data became available) and 2022, the poverty rate fell by 20 percentage points for AIAN people and by 14 percentage points for AAPI people.[18] Here, too, the increasing effectiveness of government assistance was an important factor in the declines. In 1987, government benefits and taxes lowered the AIAN poverty rate by 6 percentage points and raised the AAPI poverty rate by 1 percentage point; in 2022, they lowered AIAN poverty by 16 percentage points and lowered AAPI poverty by 6 percentage points.
For children, government programs play an even larger role in lowering poverty — and enhancing opportunity — and narrowing racial and ethnic inequities. Between 1970 and 2022, the poverty rate fell by 40 percentage points among Black children, 37 percentage points among Latino children, and 13 percentage points among white children, though the white child poverty rate remained by far the lowest of the three.
In 2022, the poverty rate was 20 percentage points higher for Black children than for white children before accounting for government assistance and taxes but 11 percentage points higher after accounting for them. Similarly, government assistance and taxes reduced the difference between the Latino and white child poverty rates from about 19 percentage points to about 12 percentage points. (See Figure 7.)

Poverty among AIAN and AAPI children has fallen substantially over the last 35 years, dropping by 27 percentage points and 23 percentage points, respectively, between 1987 and 2022. The increasing effectiveness of government programs in reducing child poverty contributed to those declines. In 1987, government benefits and the taxes they paid lowered the AIAN child poverty rate by 4 percentage points and increased AAPI child poverty by 2 percentage points; in 2022 they lowered AIAN child poverty by 16 percentage points and lowered AAPI child poverty by 5 percentage points.
Despite this progress, past and present discrimination and inequities in both the private sector and public policies keep child poverty rates higher for Latino, AIAN, Black, and AAPI children than for white children. In 2022, 19.6 percent of Latino children, 18.8 percent of AIAN children, 18.4 percent of Black children, 10.1 percent of AAPI children, and 7.2 percent of white children lived in poverty.
Stronger Aid Policies Would Avoid Gaps in Future Recessions, Enable Further Progress Against Poverty
The above data demonstrate that large-scale, emergency action in the pandemic was remarkably successful at keeping millions of people above the poverty line. At the same time, delays and gaps in aid were common, in part because of shortfalls in the nation’s underlying economic security programs, which do too little even in normal economic times to support struggling families, children, and workers. These shortfalls meant that agencies tasked with creating and implementing major new programs and policies in the midst of a pandemic were starting at a disadvantage. Many jobless individuals waited weeks for unemployment insurance due to slow and outdated unemployment insurance benefit systems. Others weren’t covered by stimulus payments or other assistance because of their (or a family member’s) immigration status or for other reasons. Some short-term indicators of economic strain or uncertainty, such as food pantry utilization, increased.[19]
Many of the problems could have been avoided if stronger economic security policies had been in place before the pandemic. For example, making permanent reforms to the unemployment insurance system would better support workers in the next recession.[20] The current unemployment system fails to provide help to most unemployed workers due to narrow eligibility requirements, provides low benefits to many who do qualify, and often ends assistance before a worker has successfully found their next job. The pandemic-era unemployment benefit changes addressed each of these issues, though they had to be stood up hastily and utilized aging infrastructure that was not up to the task of responding during the COVID crisis. The end of the temporary provisions brought a return to an unemployment system that poorly serves workers and makes temporary job losses financially disastrous for too many workers and their families.
More broadly, to recapture and build on the progress against poverty made during the pandemic, policymakers will need to strengthen economic supports for families who face difficulties affording the basics — whether during a recession or in normal economic times, when individual families also face hardships due to layoffs, illness, caregiving responsibilities, or other circumstances. Other countries have taken such an approach, providing greater financial assistance and access to health coverage during good times and bad.
For example, despite tremendous progress in reducing poverty and advancing equity over the last 50 years, large gaps in U.S. anti-poverty policies continue to leave children more exposed to poverty than in other nations. Before the pandemic, 20 percent of U.S. children lived in families with incomes below half of the national median, the poverty measure most commonly used for international comparisons. This is a much higher share than in any of the world’s 18 other similarly wealthy nations, where between 3 and 15 percent of children are poor.[21]
A number of temporary, pandemic-era policies were effective in supporting children in families with low incomes, including an expanded Child Tax Credit that provided the full credit to children in the lowest-income families, increased support for child care and housing, and summer food benefits to prevent food insecurity from rising when children don’t have access to meals at school. Congress took a modest further step in 2022 when it created a permanent summer food assistance program, but action in the remaining policy areas is needed to make a sizable dent in child poverty. Such investments would help families meet everyday challenges, with all the long-term payoffs that economic security for children provides, and give much-needed support to families during the next recession or economic crisis.[22]
The U.S. can afford these kinds of investments — indeed, other similarly wealthy nations invest larger shares of their economies in family benefits such as child payments and allowances, parental leave benefits, and child care support.[23] But this will require the right fiscal policy choices, including raising revenues from high-income people and corporations so we have the resources we need to make important investments that improve economic security and broaden opportunity. The 2025 tax debate over the fate of the 2017 tax cuts provides an opportunity to shift from policies that hollow out our revenue base to policies that raise revenues for important national priorities.[24]
Appendix I: Methodological Notes
This appendix provides some more detailed explanation of our methods.[25]
Defining Economic Security Programs
This report uses the terms “economic security programs,” “government assistance,” and “government benefits” interchangeably. In our calculations these benefits refer to: Social Security, unemployment insurance, workers’ compensation, veterans’ benefits, Temporary Assistance for Needy Families (TANF), state General Assistance, Supplemental Security Income (SSI), SNAP, the National School Lunch Program, the Special Supplemental Nutrition Program for Women, Infants, and Children (WIC), rental assistance (such as Section 8 and public housing), home energy assistance, the EITC, and the Child Tax Credit. Benefit figures for 2008-2010 also reflect a number of temporary federal benefits enacted in response to the Great Recession: the 2008 stimulus payment, 2009 economic recovery payment, and 2009-2010 Making Work Pay Tax Credit. Benefit figures for 2020-2021 include economic impact payments, and figures for 2021 include broadband assistance. Taxes, subtracted from family resources, are family members’ federal and state income and payroll taxes.
Measuring Inequities in Poverty Rates
When describing progress over time in reducing inequities between racial and ethnic groups, this report focuses on percentage point differences in poverty rates. This approach has the advantage that large percentage point differences show that the inequities affect a large percentage of the population of a given group.
For example, suppose the Black poverty rate falls from 20 percent to 2 percent and the white rate falls from 10 percent to 1 percent. Using percentage point differences, we would say that the Black poverty rate fell 18 percentage points and the white rate fell by 9 percentage points, narrowing the difference between the Black and white poverty rates from 10 percentage points to 1 percentage point. This would represent substantial progress in reducing racial inequities in the sense that the added burden of poverty on the Black population relative to the white population has sharply declined.
Use of some other measures of inequity would not reveal this progress. In the above example, for instance, the ratio of Black to white poverty rates remains unchanged, at 2 to 1. Looking only at this ratio would highlight a genuine inequity (the Black population is still twice as poor as the white population) but obscure the important fact that this inequity now affects the poverty status of many fewer Black people.
In another example, suppose the Black poverty rate rises from 30 percent to 60 percent and the white rate rises from 10 to 30 percent. Here, the ratio of the Black rate to the white rate would fall from 3.0 to 2.0, even though both groups have become poorer and the added burden that poverty places on the Black population relative to the white population (60 percent versus 30 percent) has grown in a way that encompasses a much larger share of the Black population (30 percent are newly poor) than the white population (20 percent are newly poor). Calling this an advance in equity would be misleading.
Main Findings Are Similar When Using Relative Rather Than Anchored SPM Thresholds
Figures in this report use an SPM threshold “anchored” to 2022. That is, poverty is defined as having family resources below the Supplemental Poverty Measure’s poverty threshold established by the Bureau of Labor Statistics for 2022, adjusted in earlier years for inflation using the Labor Department’s consumer price index retroactive series. (The threshold is also adjusted for family size and composition, homeownership status, and local housing costs. In 2022, this threshold was $34,518 for a two-adult, two-child family renting in an average-cost community.[26]) Figures may differ from figures in previous CBPP reports that were anchored to an earlier year or published Census SPM figures, which are not anchored.
Another version of the SPM — the unanchored or “relative” SPM — takes into account evolving societal standards of poverty over long periods of time by updating the poverty thresholds each year based on gradual changes in what most families spend on basic necessities.[27] Poverty declines less over the long term when a relative SPM poverty measure is used because the amount that families spend on necessities tends to rise slightly faster than inflation over time, meaning the relative measure’s poverty threshold rises faster as well.
But under both relative and anchored versions of the poverty measure, poverty rates reached record lows in 2020 and 2021, overall and for children. Similarly, under both measures, the declines in the number and percentage of people and children in poverty in 2020 and 2021 were the largest on record, and the increases in the number and percentage of people and children in poverty in 2022 were the largest on record, in data back to 1967.
This analysis uses an anchored series to ensure that trends are purely due to changes in families’ resources, not changes in the poverty thresholds, in accordance with this paper’s focus on the evolving role of government assistance. (Census’ official poverty measure also uses thresholds that are adjusted each year only for inflation.)
The Excel appendix tables published along with this report include trends using both the anchored and relative SPM thresholds.
Appendix II: Supplemental Tables
Supplemental tables can be accessed here:
https://www.cbpp.org/sites/default/files/spm_appendix_2024.xlsx
| Tables using 2022 SPM poverty line adjusted for inflation |
|---|
|
|
|
|
|
|
|
|
|
|
|
| Tables using "relative" SPM thresholds (that is, adjusted annually for changes in basic needs spending) |
|
|
|
|
|
|
|
|
|
|
|
|
End Notes
[1] Kris Cox et al., “About 16 Million Children in Low-Income Families Would Gain in First Year of Bipartisan Child Tax Credit Expansion,” CBPP, updated January 22, 2024, https://www.cbpp.org/research/federal-tax/about-16-million-children-in-low-income-families-would-gain-in-first-year-of.
[2] Chris Wimer et al., Historical Supplemental Poverty Measure Data, Columbia Population Research Center, 2017, https://www.povertycenter.columbia.edu/historical-spm-data. We accessed CPS data partly via IPUMS-CPS, University of Minnesota, www.ipums.org.
[3] Using a recent year’s SPM threshold and adjusting it back for inflation (using the Labor Department’s consumer price index retroactive series) creates an SPM series “anchored” to recent years’ poverty standards. Some analysts prefer the anchored SPM over the standard or “relative” SPM, which allows poverty thresholds to grow slightly faster than inflation as living standards rise across decades. This analysis uses an anchored series to ensure that trends are purely due to changes in families’ resources, not changes in the poverty thresholds. Chris Wimer et al., “Trends in Poverty with an Anchored Supplemental Poverty Measure,” Columbia Population Research Center Working Paper No. 13-01, December 2013, https://academiccommons.columbia.edu/doi/10.7916/D8RN3853. We anchor all poverty thresholds to 2022, the latest SPM threshold available. Figures in this report may differ from figures in previous CBPP reports that were anchored to an earlier year or from published Census figures, which are not anchored. Poverty declines less over the long term when a relative SPM poverty measure is used, but under both relative and anchored versions of the poverty measures, poverty rates reached record lows in 2020 and 2021, overall and for children.
[4] These figures account for all public benefits, including permanent programs such as Social Security, food assistance, rental vouchers, regular state unemployment insurance, Temporary Assistance for Needy Families (TANF), the EITC, and the Child Tax Credit, as well as pandemic programs such as stimulus payments and supplemental unemployment benefits and food assistance (net of federal and state income taxes and payroll taxes). Consistent with similar comparisons by the Census Bureau and other analysts, this comparison looks at the effect of assistance programs on family resources and presumes no change in behavior.
[5] In 2018 Census released data based on an updated processing system. To facilitate comparisons across time, Census released two versions of 2016 and 2017 data: one comparable to 2018 and the other comparable to earlier years. When making comparisons in this report, we use the appropriate version depending on the years being compared. For details on the changes in the Census survey, see Liana Fox, “The Supplemental Poverty Measure: 2018,” U.S. Census Bureau, October 2019, https://www.census.gov/content/dam/Census/library/publications/2019/demo/p60-268.pdf.
[6] Poverty rates for 2020 and 2021 were lower than for earlier years — and the anti-poverty impact of economic security programs was higher — to a degree that cannot be attributed to the change in survey methods. The 2017 poverty rate using thresholds anchored to 2022 was 14.6 percent when using the new methods and 15.5 percent when using the previous methods. Government assistance and taxes reduced poverty by 43 percent in 2017 when using the new methods and 41 percent when using the previous methods.
[7] Danilo Trisi, “Government’s Pandemic Response Turned a Would-Be Poverty Surge Into a Record Poverty Decline,” CBPP, August 29, 2023, https://www.cbpp.org/research/poverty-and-inequality/governments-pandemic-response-turned-a-would-be-poverty-surge-into.
[8] Irwin Garfinkel et al., “The Benefits and Costs of a Child Allowance,” Journal of Benefit-Cost Analysis, Vol. 13, Issue 3, Fall 2022, https://doi.org/10.1017/bca.2022.15; and Lisa A. Gennetian and Katherine Magnuson, “Three Reasons Why Providing Cash to Families With Children Is a Sound Policy Investment,” CBPP, May 11, 2022, https://www.cbpp.org/research/income-security/three-reasons-why-providing-cash-to-families-with-children-is-a-sound.
[9] National Academies of Sciences, Engineering, and Medicine, A Roadmap to Reducing Child Poverty, National Academies Press, 2019, https://www.nap.edu/read/25246.
[10] George Fenton, “New Study Finds Income Support in Childhood Increases Future Earnings,” CBPP, June 21, 2022, https://www.cbpp.org/blog/new-study-finds-income-support-in-childhood-increases-future-earnings; Martha J. Bailey et al., “Is the Social Safety Net a Long-Term Investment? Large-Scale Evidence From the Food Stamps Program,” National Bureau of Economic Research Working Paper 26942, April 2020, http://www.nber.org/papers/w26942.pdf.
[11] Arloc Sherman and Tazra Mitchell, “Economic Security Programs Help Low-Income Children Succeed Over Long Term, Many Studies Find,” CBPP, July 17, 2017, https://www.cbpp.org/research/poverty-and-inequality/economic-security-programs-help-low-income-children-succeed-over.
[12] This report uses the term “Latino” to refer to people of any race who identify as Hispanic or Latino in Census surveys. This language does not necessarily reflect how every member of this community would describe themselves. For example, gender-inclusive terms like “Latinx” and “Latine” have emerged in recent years to represent the diversity of gender identities and expressions in the community. Black, white, and AAPI refer to people of that race alone and not Latino.
AIAN people in this report may be AIAN alone or in combination with other races and ethnicities. This includes people who self-report as American Indian, Alaska Native, Canadian Indian, and Latin American Indian. For more, see Ana I. Sánchez-Rivera, Paul Jacobs, and Cody Spence, “A Look at the Largest American Indian and Alaska Native Tribes and Villages in the Nation, Tribal Areas and States,” U.S. Census Bureau, October 3, 2023, https://www.census.gov/library/stories/2023/10/2020-census-dhc-a-aian-population.html.
[13] The analysis uses Census Bureau estimates of income and payroll taxes. One notable limitation of Census’ tax estimates is that they do not account for restrictions on EITC and Child Tax Credit eligibility for filers or dependents who lack a Social Security number, which bars certain families that include immigrants from receiving these credits. Accounting for these restrictive policies would diminish the poverty-reducing role of government assistance shown here. For Latino children, we estimate that it would likely increase their poverty rate by approximately 1 or 2 percentage points.
Figures are rounded for ease of reading. Comparisons are based on unrounded figures.
[14] As noted, these data go back to 1970 for Black and Latino children and 1987 for AIAN children. See section on “Measuring Inequities in Poverty Rates” in Appendix I for a discussion of why we use percentage point differences to measure inequities in poverty rates.
[15] In 2019, the poverty rate for Black and Latino children was 14 percentage points higher than for white children, a record low at the time in data going back to 1970.
[16] Kris Cox et al., “Top Tax Priority: Expanding the Child Tax Credit in Upcoming Economic Legislation,” CBPP, updated June 12, 2023, https://www.cbpp.org/research/federal-tax/top-tax-priority-expanding-the-child-tax-credit-in-upcoming-economic.
[17] Danilo Trisi and Matt Saenz, “Economic Security Programs Reduce Overall Poverty, Racial and Ethnic Inequities,” CBPP, updated July 1, 2021, https://www.cbpp.org/research/poverty-and-inequality/economic-security-programs-reduce-overall-poverty-racial-and-ethnic.
[18] While combined Asian and Pacific Islander figures are available back to 1987, separate poverty data are available for Asians and Pacific Islanders (including Hawaiians) starting in 2002. In 2022, the SPM poverty rate for the combined AAPI population was 11.5 percent, for the Asian population was 11.4 percent, and for the Native Hawaiian and Other Pacific Islander population was 13.5 percent. Further breakdowns of the Asian population are limited by sample size in the Current Population Survey data used for this analysis, but poverty rates have been shown in larger surveys to vary widely across Asian origin groups. See Ziyao Tian and Neil G. Ruiz, “Key facts about Asian Americans living in poverty,” Pew Research Center, March 27, 2024, https://www.pewresearch.org/short-reads/2024/03/27/key-facts-about-asian-americans-living-in-poverty/.
[19] Although some broad annual indicators of hardship, including food insecurity as measured by the U.S. Department of Agriculture, were statistically unchanged in 2020 and 2021, a variety of other evidence points to an increase during the pandemic in the number of households experiencing at least sporadic trouble making ends meet. This includes year-over-year increases in requests for help with food (up 97 percent), shelter (42 percent), and utilities (31 percent), according to an analysis of calls to the United Way’s “211” help line; a 55 percent rise in the number of people using food banks since before the pandemic, according to the food bank network Feeding America; and a near doubling (from $8 billion to $15.8 billion) of customers’ total estimated arrearages on electricity bills between December 31, 2019 and December 31, 2020, according to state energy assistance program directors.
See Alisha Coleman-Jensen et al., “Household Food Security in the United States in 2021,” U.S. Department of Agriculture, Economic Research Service, ERR-309, September 2022, https://www.ers.usda.gov/webdocs/publications/104656/err-309.pdf; Rachel Garg, Balaji Golla, and Matthew Kreuter, “Year 1 of COVID-19: Needs rise 59%,” Washington University in St. Louis Health Communication Research Laboratory, March 29, 2021, https://hcrl.wustl.edu/year-1-of-covid-19-needs-rise-59/; Paul Morello, “The food bank response to COVID, by the numbers,” Feeding America, March 12, 2021, https://www.feedingamerica.org/hunger-blog/food-bank-response-covid-numbers; letter from National Energy Assistance Directors Association to Xavier Becerra, Secretary, U.S. Department of Health and Human Services, March 29, 2021, https://neada.org/wp-content/uploads/2021/04/LetterHHSReleaseofFundsARP.pdf.
[20] Nick Gwyn and Jenna Gerry, “Unemployment Insurance System Unprepared for Another Recession,” CBPP and National Employment Law Project, April 18, 2023, https://www.cbpp.org/research/economy/unemployment-insurance-system-unprepared-for-another-recession.
[21]Arloc Sherman et al., “Widespread Economic Insecurity Pre-Pandemic Shows Need for Strong Recovery Package,” CBPP, July 14, 2021, https://www.cbpp.org/research/poverty-and-inequality/widespread-economic-insecurity-pre-pandemic-shows-need-for-strong. U.S. child poverty rates would stand out less among peer nations if poverty were defined as one-half of U.S. median income rather than half of each nation’s own median income. That is because average and median incomes in the U.S. are particularly high. Its relatively high overall income also means that the U.S. has relatively high capacity to further reduce child poverty, should it choose to do so. For a recent analysis of child poverty rates across countries using multiple measures, see Zachary Parolin and Stefano Filauro, “The United States’ Record-Low Child Poverty Rate in International and Historical Perspective: A Research Note,” Demography, Vol. 60, Issue 6, December 2023, https://doi.org/10.1215/00703370-11064017. Note that their analysis also includes some nations that are less comparable to the U.S. in terms of income levels.
[22] Sharon Parrott, “The Nation Has Made Progress Against Poverty But Policy Advances Are Needed to Reduce Still-High Hardship,” CBPP, July 28, 2022, https://www.cbpp.org/research/poverty-and-inequality/the-nation-has-made-progress-against-poverty-but-policy-advances.
[23] OECD Family Database, PF1.1 Public spending on family benefits, https://www.oecd.org/els/family/database.htm.
[24] Chuck Marr, Samantha Jacoby, and George Fenton, “The 2017 Trump Tax Law Was Skewed to the Rich, Expensive, and Failed to Deliver on Its Promises,” CBPP, March 5, 2024, https://www.cbpp.org/research/federal-tax/the-2017-trump-tax-law-was-skewed-to-the-rich-expensive-and-failed-to-deliver.
[25] For a more detailed discussion of some data quality issues of the Current Population Survey (CPS), the main source for the poverty estimates that Census produces and those we present in this report, see Appendix I: Methodological Notes in Trisi, https://www.cbpp.org/research/poverty-and-inequality/governments-pandemic-response-turned-a-would-be-poverty-surge-into#appendix-i-methodological-notes-cbpp-anchor.
[26] U.S. Bureau of Labor Statistics, “2022 Research Supplemental Poverty Measure Thresholds,” September 7, 2023, https://www.bls.gov/pir/spm/spm_thresholds_2022.htm.
[27] Researchers who prefer the relative SPM note that it aligns more closely with the recommendations of the 1995 National Academy of Sciences committee whose work led to the SPM. The committee found that, over decades, the view of the poverty line — that is, the minimum amount of income needed to obtain basic needs — held by both the public and poverty experts tends to rise slightly faster than inflation but more slowly than typical income levels, and this evolution is best captured by changes in the amount typical families spend on food, clothing, shelter, and utilities. The committee recommended updating the poverty threshold annually based on changes in basic needs spending, as the relative SPM poverty measure does. For more information on the development of SPM thresholds, see the SPM website of the U.S. Bureau of Labor Statistics at https://www.bls.gov/pir/spmhome.htm.
More from the Authors