EITC and Child Tax Credit Promote Work, Reduce Poverty, and Support Children’s Development, Research Finds
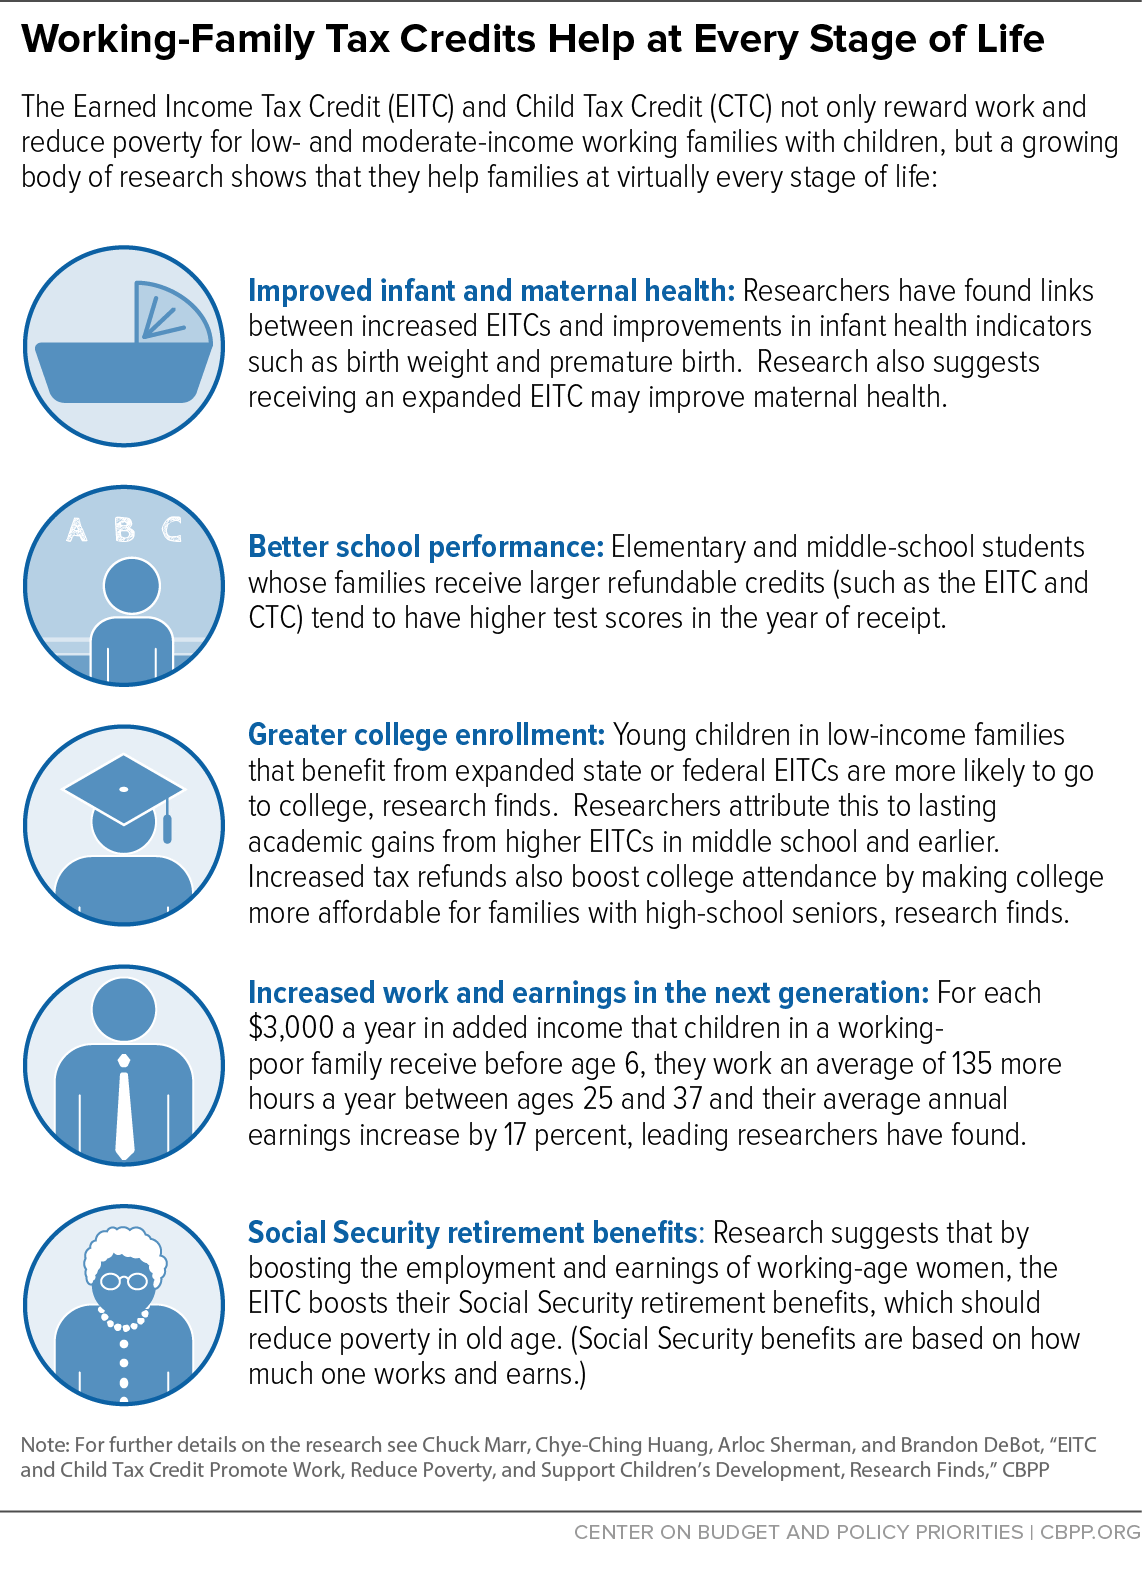
The Earned Income Tax Credit (EITC) and Child Tax Credit (CTC), which go to millions of low- and moderate-income working families each year, provide work, income, educational, and health benefits to its recipients and their children, a substantial body of research shows. In addition, recent ground-breaking research suggests the income from these tax credits leads to benefits at virtually every stage of life. For instance, research indicates that children in families receiving the tax credits do better in school, are likelier to attend college, and can be expected to earn more as adults.
Numerous studies show that working-family tax credits boost work effort. The EITC expansions of the 1990s contributed as much to the subsequent increases in work among single mothers and female heads of households as the welfare changes of that period, extensive research has found. Women who benefited from those EITC expansions also experienced higher wage growth in subsequent years than otherwise-similar women who didn’t benefit. And, by boosting the employment and earnings of working-age women, the EITC boosts the size of the Social Security retirement benefits they ultimately will receive.
In addition, the research shows that by boosting the employment of single mothers, the EITC reduces the number of female-headed households receiving cash welfare assistance. As the University of California’s Hilary Hoynes writes, the EITC “may ultimately be judged one of the most successful labor market innovations in U.S. history.”[2] The CTC is newer and has not been studied to the same extent, but it shares key design features with the EITC: it is available only to working families and phases in as earnings increase.
The EITC may also improve the health of infants and mothers, research indicates. Infants born to mothers who could receive the largest EITC increases in the 1990s had the greatest improvements in such birth indicators as low-weight births and premature births. As one researcher notes, “income transfers to pregnant women through a work-conditional tax subsidy substantially improves the health of their new born children.”[3] Similarly, mothers who received the largest EITC increases in the 1990s had greater improvements in their own health indicators.
Moreover, research suggests that income from the EITC and CTC leads to improved educational outcomes for young children in low-income households. For each $1,000 increase in annual income over two to five years, children’s school performance improves on a variety of measures, including academic test scores. A credit that’s worth about $3,000 (in 2005 dollars) during a child’s early years may boost his or her achievement by the equivalent of about two extra months of schooling.
The credits’ success in boosting work effort and earnings extends into the next generation, the new research indicates. Children whose families receive more income from refundable tax credits do better in school, are likelier to attend college, and likely earn more as adults; they also are likelier to avoid the early onset of disabilities and other illnesses associated with child poverty, which further enhances their earnings ability as adults, some research suggests.
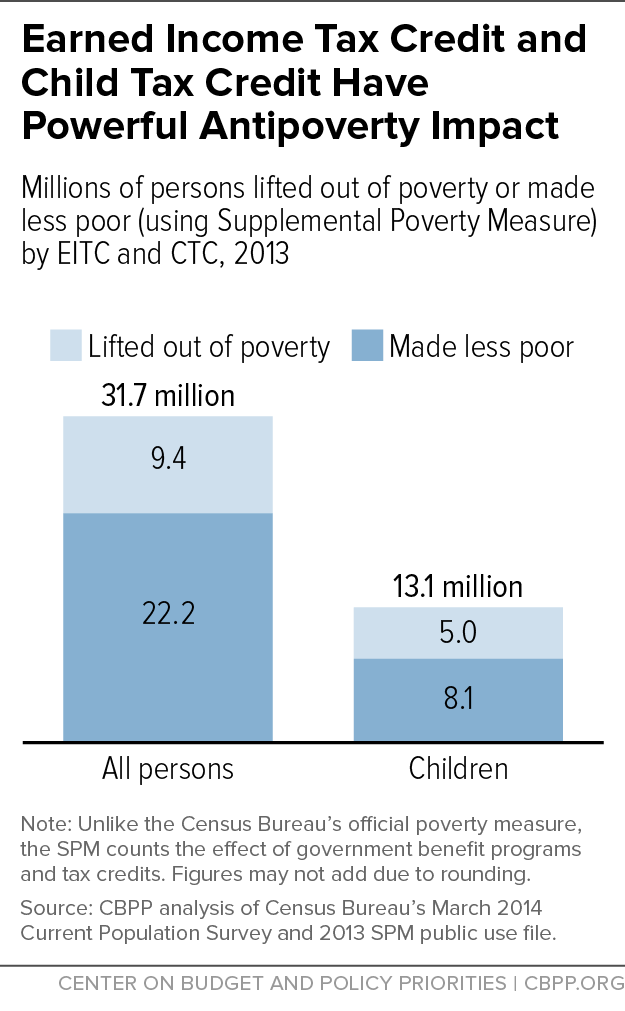
Finally, the EITC and CTC greatly reduce poverty for working families. These working-family tax credits lifted 9.4 million people out of poverty in 2013, including 5 million children, and made 22 million other people less poor. And by encouraging work, the EITC and CTC have an additional anti-poverty effect not counted in these figures. Recent research on EITC’s effects on single mothers’ employment shows that counting the employment-boosting effect of the EITC nearly doubles its anti-poverty effect for these families. These anti-poverty effects are particularly important since large numbers of Americans work for low wages, the minimum wage’s purchasing power is substantially lower than in the 1960s and 1970s, and job growth thus far in the economic recovery has been disproportionately concentrated in low-wage occupations.
As economists Austin Nichols and Jesse Rothstein summarize in a recent review of the literature on the EITC:
Researchers have documented beneficial effects on poverty, on consumption, on health, and on children’s academic outcomes. The magnitude of these effects is large: Millions of families are brought above the poverty line, and estimates of the effects on children indicate that this may have extremely important effects on the intergenerational transmission of poverty as well. Taking all of the evidence together, the EITC appears to benefit recipients — and especially their children — substantially.[4]
See the chart below for a summary of the research on the EITC and CTC.[5]
How the EITC and CTC Work
The EITC, a federal tax credit for low- and moderate-income working families and individuals, is designed to encourage and reward work, offset federal payroll and income taxes, and raise living standards. To claim the credit, a taxpayer must have earnings from a job. The EITC is “refundable,” meaning that if it exceeds a low-wage worker’s federal income tax liability, the Internal Revenue Service refunds the balance to the taxpayer.
The EITC’s primary recipients are working parents with children, though a small EITC is available to working adults without dependent children. The credit rises with earned income until reaching a maximum (which varies by the number of qualified children) and then phases out as income rises further.[6] For 2015, the phase-outs begin at about $18,810[7] for single filers with children and about $23,630 for married filers with children, and the average size of the credit is likely to be close to its 2013 value of $3,074 for a family with children and $281 for a family without children.[8] Twenty-six states plus the District of Columbia also offer a state EITC, typically set at a percentage of the federal EITC.[9]
The CTC, which provides taxpayers up to $1,000 for each dependent child under age 17, is designed to help families offset the costs of raising children.[10] Unlike the EITC, the CTC not only helps low- and moderate-income families but extends to middle-income and most upper-middle-income families as well, because it phases out at higher income levels than the EITC.[11]
Like the EITC, the CTC increases with earnings, but unlike the EITC, the first $3,000 in earnings do not count when determining the CTC. Families receive a refund equal to 15 percent of their earnings above $3,000, up to the credit’s full $1,000-per-child value. For example, a mother with two children who works full time at the federal minimum wage — earning $14,500 in 2015 — will receive a refund of $1,725 (15 percent of $11,500). This refundable part of the CTC, called the Additional Child Tax Credit, is particularly beneficial to lower-wage workers.
The CTC is newer than the EITC and has not been studied to the same extent, but like the EITC it is available only to working families and phases in as earnings increase. Research strongly suggests that low-income families do not understand how much of their tax refund comes from the EITC or the CTC, but they do understand that if they work they can qualify for significant tax-based benefits.[12] Moreover, research shows that boosting working families’ incomes is associated with improvements in children’s educational (and other) outcomes, strongly suggesting that both credits improve opportunities for children.
Encouraging Work
The EITC significantly increases recipients’ work effort, according to substantial research over the past two decades.[13] (As noted, the CTC shares key design features with the EITC, suggesting that it may also have positive work effects.)
The EITC is particularly effective at encouraging work among single mothers working for low wages.[14] It is considered among the most effective policies for increasing the work and earnings of female-headed families.
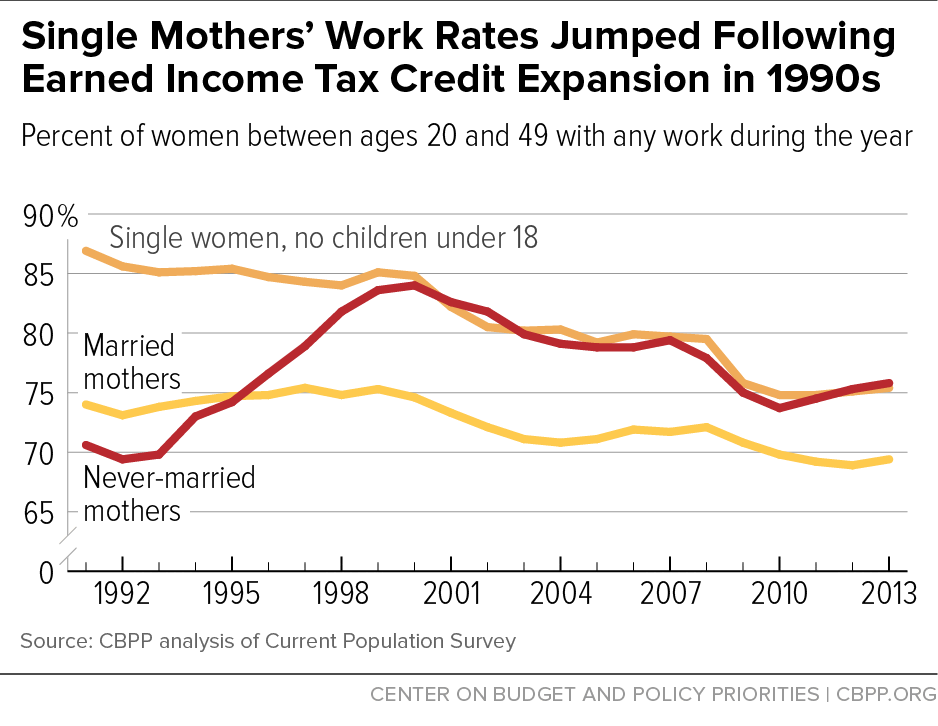
Single mothers are the group most likely to be eligible for the EITC because they tend to have low earnings and qualifying children. As Figure 1 shows, single mothers experienced a marked increase in paid employment following the EITC expansions of the early 1990s, relative to married women and single women without children.[15] Economic studies controlling for other policy and economic changes during this period also found that the most significant gains in employment attributable to the EITC occurred among mothers with young children and mothers with low education.[16] In their literature review, Nichols and Rothstein note “essentially all authors agree that the EITC expansion led to sizeable increases in single mothers’ employment rates, concentrated among less-skilled women and among those with more than one qualifying child.”[17]
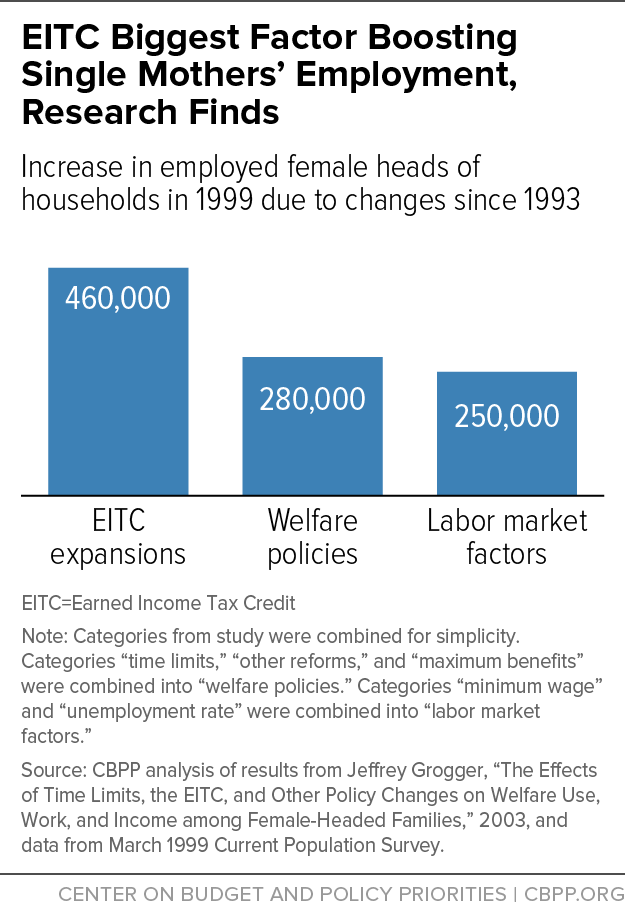
Other research has found that EITC expansions between 1984 and 1996 accounted for more than half of the large increase in employment among single mothers during that period.[18] The EITC expansions of the 1990s “appear to be the most important single factor in explaining why female family heads increased their employment over 1993-1999,” University of Chicago economist Jeffrey Grogger has concluded.[19] Those expansions, he found, actually had a larger effect in increasing employment among single mothers than the 1996 welfare law. (See Figure 2.) In addition, women who were eligible to benefit the most from those EITC expansions apparently had higher wage growth in later years than other similarly situated women.[20]
By boosting employment among single mothers, the EITC also reduces cash welfare caseloads significantly. The EITC expansions of the 1990s induced more than a half a million families to move from cash welfare assistance to work, research shows.[21] In fact, Grogger’s research found those EITC expansions likely contributed about as much to the fall between 1993 and 1999 in the number of female-headed households receiving cash welfare assistance as time limits and other welfare reform changes.[22]
Moreover, by boosting the employment and earnings of working-age women, the EITC also boosts their Social Security retirement benefits, which are based on a person’s work history. Higher Social Security benefits, in turn, reduce the extent and severity of poverty among seniors.[23]
There is little evidence that when EITC benefits phase down as a family’s income rises above certain levels, workers substantially reduce their work hours.[24] Instead, research shows, the EITC has a powerful effect in inducing many more workers to enter the labor force and go to work.
Improving Infant and Maternal Health
The EITC may improve the health of infants and mothers, research finds. Research looking at the EITC’s effects on maternal health found that women who were eligible for the largest EITC expansion in the 1990s experienced significant improvement in a variety of health indicators, including reduced mental stress, compared to similar women who would not have been eligible for the expansion.[25]
Researchers at the University of California at Davis compared changes in birth outcomes for mothers who likely received the largest increases in their EITCs under the expansions of the 1990s and mothers who likely received the smallest increases.[26] They found that infants born to mothers who likely received the largest increases had the greatest improvements in a number of birth indicators, such as fewer low-weight births and premature births.[27] Also, mothers who likely received the largest increases were likelier to receive prenatal care, including care before the critical third trimester, and to smoke and drink less during pregnancy. Changes in health insurance coverage did not seem to be a primary explanation for these improved health outcomes.[28]
Other studies have also found strong associations between EITC expansions and improvements in birth weight and indicated that mothers receiving the EITC were less likely to smoke during pregnancy than similarly situated mothers who did not receive it.[29]
Boosting Children’s School Achievement and College Attendance Rates
Income support from the EITC and CTC has been linked to better academic achievement for elementary and middle-school students.[30] Studies have found that children in low-income families that receive larger state or federal EITCs tend to score better on tests of reading and (particularly) math, compared with children from largely similar families not targeted for large credit expansions. They also are more likely to finish high school and go on to college.
In addition, larger tax refunds make college more affordable for low-income families with high-school seniors and are associated with significant increases in their college attendance.
A recent working paper examining data from before and after changes to federal and state EITCs finds that children receiving larger EITCs tend to do better academically in both the short and long term.[31] Receipt of larger EITCs is linked to:
- Higher test scores, particularly in math. Larger EITCs are linked to improved test scores in the year of receipt for both elementary and middle-school students.
- Higher high-school graduation rates. Children who qualify for a larger EITC in childhood are more likely to graduate high school or complete a General Educational Development (GED) degree.
- Higher college attendance rates. The larger the EITC a child’s family receives, the more likely he or she will enter college by age 19 or 20.
The size of these effects is noteworthy. The paper estimates that a child in a family eligible for the largest EITC expansion in the early 1990s would have a 4.8 percentage-point higher probability of completing one or more years of college by age 19 — an improvement comparable to the effect of major educational interventions such as reducing classroom size. Moreover, the findings show that the academic benefits of larger EITCs extend to children of all ages and racial and ethnic groups, with some suggestive evidence that the benefits are slightly larger for minority children and boys.
This paper adds to an already substantial body of evidence that the EITC and CTC boost school performance:
- Researchers who analyzed data for grades 3-8 from a large urban school district and the corresponding U.S. tax records for families in the district linked additional income from the EITC and CTC with significant increases in students’ test scores.[32]
- Likewise, researchers who studied nearly two decades of data on mothers and their children concluded that students with additional income from the EITC had higher combined math and reading test scores by large magnitudes.[33]
Research not directly on the tax credits also suggests that income-boosting policies like the EITC and CTC improve school performance. Researchers analyzing ten anti-poverty and welfare-to-work experiments found a consistent pattern of better school results for low-income children in programs that provided more income. Each $1,000 increase (in 2001 dollars) in annual income — the equivalent of a full CTC for one child — for two to five years led to modest but statistically significant increases in young children’s school performance on a number of measures, including test scores. The researchers noted that their results have important implications for policies that link increases in income to increases in employment, like the EITC and CTC.[34]
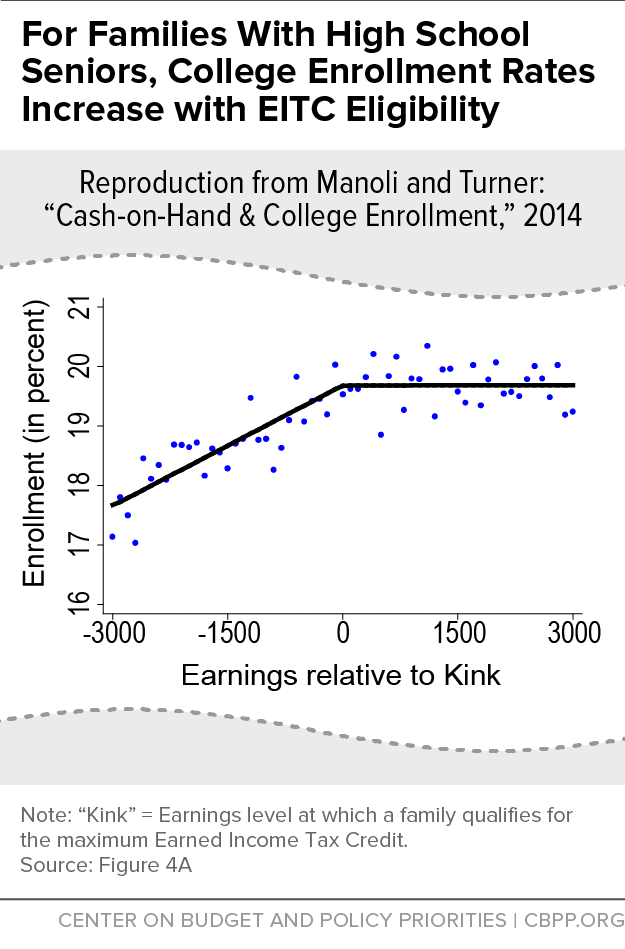
The working-family tax credits can also improve a low-income child’s chances of attending college by making it more affordable. A recent paper finds that college enrollment rates tend to rise with family earnings up to the earnings level where a family qualifies for the maximum EITC (the EITC “kink point”), at which point both enrollment rates and the size of a family’s EITC level off.[35] (See Figure 3, reproduced from the study.) This striking relationship, the researchers conclude, is evidence that, for a high-school senior whose family almost or just qualifies for the maximum EITC, a $1,000 increase in tax refunds received in the spring increases college enrollment rates the next fall by roughly 10 percent.
The study’s authors suggest that receiving the EITC in the spring before college helps cash-strapped families afford college: “[T]he tax refunds that we study may effectively alleviate credit constrain[t]s for families with high-school seniors, allowing youths from these families to attend college.” They also find that both federal and state EITCs increase college enrollment, noting, “[T]he enrollment response is larger in states that offer tax refunds tied to federal refundable credits.”
Nichols and Rothstein conclude from their review of the literature: “Taking all of the estimates together, there is robust evidence of quite large effects of the EITC on children’s academic achievement and attainment, with potentially important consequences for later-life outcomes.”[36]
Boosting Work Effort and Earnings When Children Reach Adulthood
Not only do the EITC and CTC boost the work effort of parents, particularly single mothers, but the benefits extend to the next generation, recent research suggests.
Because higher family income from working-family tax credits is associated with higher skills, children in the family likely earn more as adults. In fact, researchers projected that each dollar of income through tax credits may increase the real value of the child’s future earnings by more than one dollar.[37]
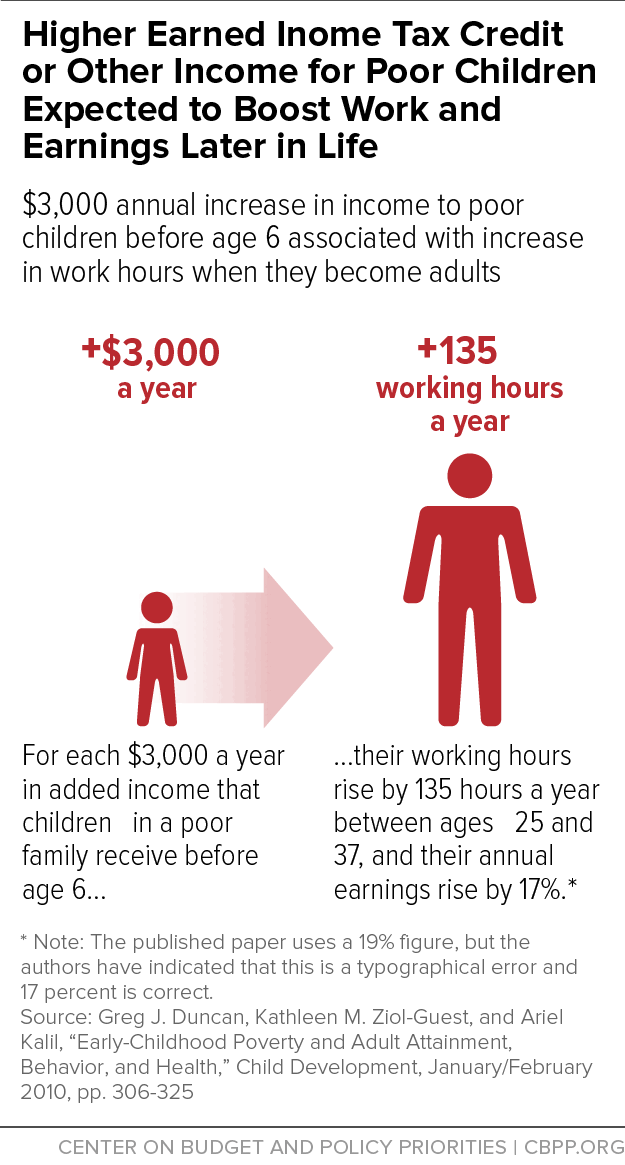
For young children raised in low-income families, even slight increases in family income — regardless of the source — are associated with more work and higher earnings in adulthood, relative to children raised in otherwise similar circumstances. For children in low-income families, an extra $3,000 in annual family income (in 2005 dollars)[38] between their prenatal year and fifth birthday is associated with an average 17 percent increase in annual earnings and an additional 135 hours of work when they become adults, compared to similar children whose families do not receive the added income, researchers have found.[39] (See Figure 4.)
One reason for poorer children’s lower work effort and earnings, according to an emerging field of research, may be that they are more likely to experience poor health as children, which in some cases carries into adulthood.[40] Thus, children in households that receive slightly higher incomes appear likelier to avoid the early onset of disabilities and other illnesses associated with child poverty, which apparently helps them earn more as adults.
In short, studies indicate that young children in low-income families that receive income support (which could include the EITC and CTC) perform better in school, on average. They also are likely to be born healthier and to grow up to work more and earn more. “When analyzing the costs and benefits of policies such as the Earned Income or Child Tax Credit,” researchers from Harvard and Columbia University advised, “policymakers should carefully consider the potential impacts of these programs on future generations.”[41]
Reducing Poverty
The EITC and CTC reduce current poverty and inequality in at least two ways (1) by supplementing the wages of low-paid poor or near-poor workers; and (2) by encouraging work.
Many Americans work for low wages. For example, the food-preparation sector (cooks, servers, dishwashers, and the like), which employs more than 12 million people and accounts for about one in every 11 jobs, provided a median wage of only $9.20 an hour in 2014. A full-time, year-round worker at that wage level would have annual earnings of $18,400 — or less than 80 percent of the poverty line for a two-adult, two-child family.[42]
For many workers, working substantial hours is not enough to lift them out of poverty.[43] The recent recession and slow recovery have aggravated the situation. The share of workers paid below-poverty wages (hourly wages too low to support a family of four at the poverty line even with full-time, year-round work) rose from 25.5 percent in 2009 to 28 percent in 2012.[44] While mid-wage jobs made up 60 percent of the jobs lost during the recession, they made up only 22 percent of the jobs gained during the recovery, according to an analysis by the National Employment Law Project that goes through the first quarter of 2012.[45] Lower-wage jobs, in contrast, represented 21 percent of the jobs lost during the recession but 58 percent of jobs gained during the recovery.
The share of Americans earning low wages may keep growing even as labor market conditions improve. “Good jobs are not disappearing for everyone, but . . . they are largely disappearing for less-educated workers,”[46] Urban Institute economist Harry Holzer and his coauthors from the National Science Foundation, the University of Chicago, and the Treasury Department have written.
Meanwhile, policymakers have let the minimum wage erode substantially. At $7.25 an hour in 2015, the federal minimum wage is 24 percent below its 1968 level, after adjusting for inflation.[47] The minimum wage and EITC are both important policies that help low-wage workers make ends meet, and both should be strengthened. They are also complementary: they function best when both are strong because each helps fill gaps that the other can’t fully address on its own, and neither is sufficient by itself.[48]
In addition, the median or typical wage paid for half of the ten occupations that the Bureau of Labor Statistics expects to generate the most new jobs over the 2012-2022 period — home health aides, food preparers, personal care aides, retail salespersons, and janitors and cleaners — was below a poverty-level wage in 2012.[49]
By supplementing the earnings of low-paid workers, the EITC and CTC lifted 9.4 million people out of poverty in 2013 and made 22 million others less poor (see Figure 5). (These figures are based on the federal government’s Supplemental Poverty Measure, which many analysts favor because it counts non-cash public benefits and refundable tax credit payments as income.)[50] These working-family tax credits lifted 5 million children out of poverty, more than any other program.
These figures do not count a second way that the EITC and CTC may reduce poverty — by encouraging work. When the income gains from the increase in employment the EITC generates are taken into account, the EITC’s impact in reducing poverty significantly increases, University of California economist Hoynes and the Treasury Department’s Ankur Patel find in recent research. Analyzing the 1990s EITC expansions for single mothers aged 24-48 who lack a college degree, Hoynes and Patel find that when the EITC’s employment and earnings effects are taken into account, the number of people in such families that the EITC lifts out of poverty nearly doubled.[51]
Hoynes and Patel examined these families, not EITC beneficiaries as a whole, so they could not similarly calculate the extent to which the EITC’s employment and related earnings effects increase the overall number of people the EITC lifts out of poverty. But based on the anti-poverty impacts they find with respect to the mothers and children they examined, they provide a rough estimate that the standard estimate of the total number of people the EITC lifts out of poverty may understate the true number by “as much as 50 percent.”[52]
Further, the emerging research discussed above suggests that by improving children’s health and educational outcomes, and by leading to higher earnings as adults, the working-family tax credits also may reduce poverty in the next generation.
Each of these factors also reduces inequality by boosting the after-tax income of low-wage workers relative to high-income earners.
Additionally, as noted above, 26 states and the District of Columbia have built on the success of the federal credits by offering their own EITCs, which further reduce poverty and inequality.[53]
Providing a Short-Term Safety Net
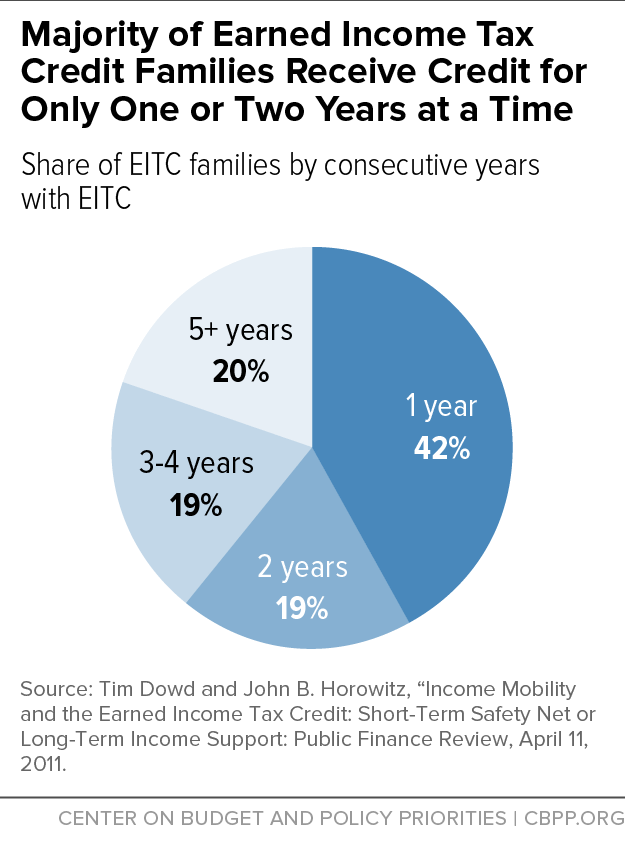
The latest research, which covers years before the Great Recession and an EITC expansion, shows that the EITC provides ongoing income support for some low-wage workers but helps even more workers meet a temporary need.[54] “The EITC,” researchers found, “acts as a short-term safety net to many taxpayers who claim the EITC for short periods during shocks to income or family structure”[55] — a child’s birth, for instance, or one spouse’s loss of income — after which their earnings grow again.[56]
Some 61 percent of those who received the EITC between 1989 and 2006 did so for only a year or two at a time.[57] (See Figure 6.) About half of all taxpayers with children used the EITC at least once during that 18-year period. With its broad but temporary reach, the EITC provides critical income insurance for working families that face hardship or must care for newborns or very young children.[58]
In addition, low-income households pay substantial taxes. Most state and local tax systems are regressive, meaning that low-income families pay a larger share of their incomes in these taxes than more affluent households do.[59] The bottom fifth of households paid an average of 10.9 percent of their incomes in state and local taxes in 2012, according to the Institute on Taxation and Economic Policy (ITEP), compared to 9.4 percent for the middle fifth and 5.4 percent for the top 1 percent. (ITEP also found that in most states, families in the bottom income fifth paid a larger share of their incomes in state and local income, property, sales, and excise taxes than families in the top end of the distribution.[60]) Also, some EITC recipients pay significant federal income taxes over time, even though they may receive more in EITC benefits in a given year than they pay in federal income taxes in that year.[61]
Conclusion
Recent ground-breaking research suggests that the EITC and CTC help families at virtually every stage of life. In addition to the credits’ well-established benefits of encouraging work and reducing poverty, recent research suggests that starting from infancy — when higher tax credits are linked to more prenatal care, less maternal stress, and signs of better infant health — children who benefit from tax credit expansions have been found to do better throughout childhood and have higher odds of finishing high school and thus going on to college. The education and skill gains associated with the CTC and EITC likely keep paying off for many years through higher earnings and employment, researchers say. This growing body of research highlights the positive long-term benefits of the working-family tax credits for millions of families.
End Notes
[1] Indivar Dutta-Gupta and Jimmy Charite co-authored previous versions of this paper.
[2] Hilary Hoynes, “A Revolution in Poverty Policy: The Earned Income Tax Credit and the Well-Being of American Families,” Pathways, Summer 2014, pp. 23-27, http://web.stanford.edu/group/scspi/_media/pdf/pathways/summer_2014/Pathways_Summer_2014.pdf.
[3] David Simon, “Expansions to the Earned Income Tax Credit Improved the Health of Children Born to Low Income Mothers,” London School of Economics, June 9, 2015, http://bit.ly/1du6YrW.
[4] Austin Nichols and Jesse Rothstein, “The Earned Income Tax Credit (EITC),” NBER Working Paper No. 21211, May 2015, http://www.nber.org/papers/w21211.pdf, p. 5.
[5] See also: “Chart Book: The Earned Income Tax Credit and Child Tax Credit,” Center on Budget and Policy Priorities, revised January 16, 2015, https://www.cbpp.org/cms/index.cfm?fa=view&id=5253.
[6] For more on how the EITC operates, see “Policy Basics: The Earned Income Tax Credit,” Center on Budget and Policy Priorities, updated August 20, 2015, https://www.cbpp.org/research/federal-tax/policy-basics-the-earned-income-tax-credit.
[7] The credit value is determined by IRS tables in the Form 1040 instructions that use $50 increments for the filer’s earned income amount. For example, if a filer earned $8,278, the filer would be in the $8,250-$8,300 earnings bracket, which uses $8,275 to calculate the dollar amount for the EITC for all filers with earnings in that bracket.
[8] CBPP calculations based on Internal Revenue Service Compliance Data Warehouse data.
[9] For more on state EITCs, see: Erica Williams and Michael Leachman, “States Can Adopt or Expand Earned Income Tax Credits to Build a Stronger Future Economy,” Center on Budget and Policy Priorities, updated February 18, 2015, https://www.cbpp.org/cms/index.cfm?fa=view&id=4084.
[10] For more on how the CTC operates, see “Policy Basics: Child Tax Credit,” Center on Budget and Policy Priorities, updated August 20, 2015, https://www.cbpp.org/research/policy-basics-the-child-tax-credit.
[11] The CTC begins to phase out at incomes of $75,000 for single parents filing as heads of household, $110,000 for married couples filing jointly, and $55,000 for married couples filing separately. The income level at which the credit phases out completely depends on the number of qualifying children. For example, the credit phases out at $150,000 for married couples filing jointly with two children.
[12] See: Ruby Mendenhall et al., “The Role of Earned Income Tax Credit in the Budgets of Low-Income Families,” Social Service Review, February 2012; Sarah Halpern-Meekin et al., It’s Not Like I’m Poor, University of California Press, January 2015.
[13] For a summary of research on the EITC, see V. Joseph Hotz and John Karl Scholz, “The Earned Income Tax Credit,” in Robert A. Moffitt, ed., Means-Tested Transfer Programs in the United States (Chicago: The University of Chicago Press, 2003) and Bruce Meyer, “The Effects of the Earned Income Tax Credit and Recent Reforms,” in Jeffrey R. Brown, ed., NBER Book Series Tax Policy and the Economy (National Bureau of Economic Research, 2010), http://www.nber.org/chapters/c11973. The refundable CTC is much newer and has not been studied as extensively.
[14] Chris M. Herbst, “The labor supply effects of child care costs and wages in the presence of subsidies and the earned income tax credit,” November 17, 2009, http://www.chrisherbst.net/files/Download/C._Herbst_Labor_Supply_Effects.pdf.
[15] For a longer examination of the trends in female labor force participation, see “Chart Book: TANF at 19,” Center on Budget and Policy Priorities, August 19, 2015, https://www.cbpp.org/research/family-income-support/chart-book-tanf-at-19.
[16] See Bruce D. Meyer and Dan T. Rosenbaum, “Making Single Mothers Work: Recent Tax and Welfare Policy and its Effects,” in Bruce D. Meyer and Douglas Holtz-Eakin, eds., Making Work Pay: The Earned Income Tax Credit and Its Impact on America’s Families (New York: Russell Sage Foundation, 2001); Bruce D. Meyer and Dan T. Rosenbaum, “Welfare, The Earned Income Tax Credit, and the Labor Supply of Single Mothers,” Quarterly Journal of Economics 116(3): 1063-2014; and Nada Eissa and Jeffrey B. Liebman, “Labor Supply Response to the Earned Income Tax Credit,” Quarterly Journal of Economics, May 1996.
[17] Nichols and Rothstein also note that the research finds “effects on hours of work were generally small.” Nichols and Rothstein, p. 40. For further discussion of the effects on hours worked, see footnote 24.
[18] See Meyer and Rosenbaum, “Making Single Mothers Work: Recent Tax and Welfare Policy and its Effects,” and Meyer and Rosenbaum, “Welfare, The Earned Income Tax Credit, and the Labor Supply of Single Mothers.”
[19] Jeffrey Grogger, “The Effects of Time Limits, the EITC, and Other Policy Changes on Welfare Use, Work, and Income among Female-Head Families,” Review of Economics and Statistics, May 2003. Using different data, in another study, Grogger reaches similar conclusions. Jeffrey Grogger, “Welfare Transitions in the 1990s: the Economy, Welfare Policy, and the EITC,” NBER Working Paper No. 9472, January 2003, http://www.nber.org/papers/w9472.pdf.
[20] Molly Dahl, Thomas DeLeire, and Jonathan A. Schwabish, “Stepping Stone or Dead End? The Effect of the EITC on Earnings Growth,” Institute for the Study of Labor, revised April 2009, http://ftp.iza.org/dp4146.pdf.
[21] Stacy Dickert, Scott Houser, and John Karl Scholz, “The Earned Income Tax Credit and Transfer Programs: A Study of Labor Market and Program Participation,” Tax Policy and the Economy, Vol. 9, MIT Press, 1995. V. Joseph Holt, Charles H. Mullin, and John Karl Scholz also showed that the EITC was an important tool encouraging welfare recipients to enter the labor force. V. Joseph Holt, Charles H. Mullin, and John Karl Scholz, “Examining the Effect of the Earned Income Tax Credit on the Labor Market Participation of Families on Welfare,” NBER Working Paper No. 11968, January 2006, http://www.nber.org/papers/w11968.
[22] Grogger, 2003.
[23] Molly Dahl, Jonathan Schwabish, Thomas DeLeire, and Timothy Smeeding, “The Earned Income Tax Credit and Expected Social Security Retirement Benefits Among Low-Income Women,” Congressional Budget Office, revised March 5, 2012, http://www.cbo.gov/publication/43033.
[24] Once EITC recipients reach the phase-out range, recipients with no children have their EITC reduced by 8 cents for each additional dollar earned, recipients with one child have their EITC reduced by 16 cents, and recipients with two or more children have their EITC reduced by 21 cents. In theory, the phase-out could discourage additional hours of work among those with incomes in the phase-out range. The only studies to find a reduction in work hours, however, have found such effects to be small. Moreover, those studies generally found such effects only among married EITC recipients, and many analysts believe this effect is likely due largely to the fact that the additional income the EITC provides allows the second earner in some married families to choose to spend more time raising children and less time working out of the home. Analysts across the political spectrum have observed that the fact that the EITC may lead some married parents to make such a choice should not be regarded as an adverse policy outcome. See David T. Ellwood, “The Impact of the Earned Income Tax Credit and Social Policy Reforms on Work, Marriage, and Living Arrangements,” National Tax Journal, Vol. 53, No. 4, December 2000, http://papers.ssrn.com/sol3/papers.cfm?abstract_id=251104.
[25] William N. Evans and Craig L. Garthwaite, “Giving Mom a Break: The Impact of Higher EITC Payments on Maternal Health,” American Economic Journal: Economic Policy (6)2, 2014, pp. 258-290. Health indicators include self-reported “excellent” and “very good” health days per month, number of bad mental health days in the past month, and biomarkers of elevated stress levels from physical, blood, and urine tests.
[26] The authors controlled for welfare reform, changes in Medicaid or CHIP income eligibility thresholds, the unemployment rate, and the unique impact that belonging to a particular demographic or socio-economic group, living in a particular state, having a particular number of children, and idiosyncrasies of a particular year might have on the incidence of low birth weights for each group of women in their analysis.
[27] Hilary W. Hoynes, Douglas L. Miller, and David Simon, “The EITC: Linking Income to Real Health Outcomes,” University of California Davis Center for Poverty Research, Policy Brief, 2013, http://poverty.ucdavis.edu/research-paper/policy-brief-linking-eitc-income-real-health-outcomes.
[28] Hilary W. Hoynes, Douglas L. Miller, and David Simon, “Income, The Earned Income Tax Credit, and Infant Health,” NBER Working Paper No. 18206, July 2012, http://www.nber.org/papers/w18206.
[29] Kevin Baker, “Do Cash Transfer Programs Improve Infant Health: Evidence from the 1993 Expansion of the Earned Income Tax Credit,” University of Notre Dame mimeo, 2008, http://economics.nd.edu/assets/24011/baker_paper.pdf; and Kate W. Strully, David H. Rehkopf, and Ziming Xuan, “Effects of Prenatal Poverty on Infant Health: State Earned Income Tax Credits and Birth Weight,” American Sociological Review (August 2010), 1–29, http://www.irp.wisc.edu/newsevents/workshops/2011/participants/papers/15-Strully.pdf.
[30] For a discussion of the research on the impact of early childhood poverty on future outcomes, see Greg J. Duncan and Katherine Magnuson, “The Long Reach of Early Childhood Poverty,” Pathways, Winter 2011, pp. 22-27, http://www.stanford.edu/group/scspi/_media/pdf/pathways/winter_2011/PathwaysWinter11_Duncan.pdf. For a more technical discussion of the evidence, see Greg J. Duncan, Pamela A. Morris, and Chris Rodrigues, “Does Money Really Matter? Estimating Impacts of Family Income on Young Children’s Achievement with Data from Random-Assignment Experiments,” Developmental Psychology (June 2011), pp. 1263–1279.
[31] Michelle Maxfield, “The Effects of the Earned Income Tax Credit on Child Achievement and Long-Term Educational Attainment.” Michigan State University Job Market Paper, November 14, 2013, https://www.msu.edu/~maxfiel7/20131114%20Maxfield%20EITC%20Child%20Education.pdf.
[32] Raj Chetty, John N. Friedman, and Jonah Rockoff, “New Evidence on the Long-Term Impacts of Tax Credits,” Statistics of Income Paper Series, November 2011, http://www.irs.gov/pub/irs-soi/11rpchettyfriedmanrockoff.pdf.
[33] Gordon Dahl and Lance Lochner, “The Impact of Family Income on Child Achievement: Evidence From The Earned Income Tax Credit,” American Economic Review (2012), pp. 1927-1956, http://www.aeaweb.org/articles.php?doi=10.1257/aer.102.5.1927.
[34] Duncan, Morris, and Rodrigues, 2011.
[35] Dayanand S. Manoli and Nicholas Turner, “Cash-on-hand and College Enrollment: Evidence From Population Tax Data and Policy Nonlinearities,” NBER Working Paper No. 19836, January 2014, http://www.nber.org/papers/w19836.
[36] Nichols and Rothstein, p. 39.
[37] Chetty, Friedman, and Rockoff 2011.
[38] The authors refer to pre-tax income here. However, they had fairly similar findings when they re-estimated their models using childhood income after federal income taxes.
[39] The paper says 19 percent, but our calculations, confirmed by one of the authors, show that this is a typographical error and 17 percent is correct. Duncan, Ziol-Guest, and Kalil, 2010.
[40] Kathleen M. Ziol-Guest, Greg J. Duncan, Ariel Kalil, and W. Thomas Boyce, “Early childhood poverty, immune-mediated disease processes, and adult productivity,” Proceedings of the National Academy of Sciences of the United States of America (October 16, 2012), 17289-17293.
[41] Chetty, Friedman, and Rockoff, 2011.
[42] Bureau of Labor Statistics, Occupational Employment Statistics, http://www.bls.gov/oes/current/oes_nat.htm; U.S. Census Bureau, http://www.census.gov/hhes/www/poverty/data/threshld.
[43] For example, over 11 million workers lived below the official poverty line in 2013. Among these workers, the median number of weeks worked per year was 40. The median number of hours worked per week was 35. CBPP analysis of March 2014 Current Population Survey.
[44] Economic Policy Institute, The State of Working America, 12th edition, http://stateofworkingamerica.org/data/.
[45] The figures here contrast job losses between the first quarter of 2008 and the first quarter of 2010 with job gains between the first quarter of 2010 and the first quarter of 2012. The National Employment Law Project defines lower-wage jobs as those with median hourly wages from $7.69 to $13.83 (in 2012 dollars) and mid-wage jobs as those with median hourly wages from $13.84 to $21.13. To place these figures in context, in 2012, the year-round, full-time earnings of a lower-wage job are equivalent to between 66 percent and 119 percent of a two-adult, two-child family’s federal poverty threshold. National Employment Law Project, “The Low-Wage Recovery and Growing Inequality,” August 2012, http://nelp.3cdn.net/8ee4a46a37c86939c0_qjm6bkhe0.pdf.
[46] Harry J. Holzer, Julia I. Lane, David B. Rosenblum, and Fredrik Andersson, Where are All the Good Jobs Going? (New York: Russell Sage Foundation, 2011), p. 17.
[47] CBPP analysis of data from the U.S. Department of Labor, Wage and Hour Division, Bureau of Labor Statistics, http://www.dol.gov/whd/minwage/chart.htm.
[48] For example, the EITC adjusts to reflect family size and income, while the minimum wage doesn’t. The EITC’s pro-work effects may put modest downward pressure on wages, an effect that the minimum wage counters by establishing a wage floor. The EITC is provided as a tax refund that comes once a year and can help with large, one-time expenses, while the minimum wage is reflected in each paycheck. For more, see: Robert Greenstein, “Strengthen Minimum Wage – and EITC,” Center on Budget and Policy Priorities, May 27, 2015, https://www.cbpp.org/blog/strengthen-minimum-wage-and-eitc.
[49] Bureau of Labor Statistics, Occupational Outlook Handbook, http://www.bls.gov/ooh/most-new-jobs.htm. We define the poverty-level wage as the wage level needed to bring a family of four to the poverty line with full-time, year-round work. For 2014, this is $24,008.
[50] CBPP analysis of the Census Bureau’s March 2014 Current Population Survey and SPM public use file. For state-by-state anti-poverty and other numbers relating to the credits, see our state fact sheets at https://www.cbpp.org/research/federal-tax/state-fact-sheets-the-earned-income-and-child-tax-credits.
[51] Hilary W. Hoynes and Ankur J. Patel, “Effective Policy for Reducing Inequality? The Earned Income Tax Credit and the Distribution of Income,” NBER Working Paper No. 21340, July 2015, http://www.nber.org/papers/w21340.pdf.
[52] As Hoynes and Patel note, their findings do not reflect any downward pressure on market wages caused by more workers looking for jobs due to the EITC.
[53] Erica Williams, “State EITCs Narrow the Gap Between Rich and Poor,” Center on Budget and Policy Priorities, June 1, 2015, https://www.cbpp.org/blog/state-eitcs-narrow-the-gap-between-rich-and-poor.
[54] The CTC is meant to offset the costs of child rearing and has higher income phase-out levels to reach the broader middle class, so families may receive the CTC for longer periods of time than the EITC.
[55] Dowd and Horowitz, 2011.
[56] While the EITC and CTC can provide a safety net for families over short periods of time, this does not necessarily mean that credits are counter-cyclical (such that the aggregate amount of the EITC and CTC automatically increases in recessions). Researchers have found the EITC’s pro- and counter-cyclical effects overall to be ambiguous, and differ between family types. For example, some families who received a credit may receive a smaller credit or none at all if their incomes drop too low. See Marianne Bitler, Hilary Hoynes, and Elira Kuka, “Do In-Work Tax Credits Serve as a Safety Net?” NBER Working Paper No. 19785, January 2014, http://www.nber.org/papers/w19785.
[57] These findings do not imply that EITC recipients only use the EITC once or twice over their entire working career. Rather, they suggest that the majority of EITC recipients use the credit for short periods at a time. Another study, covering EITC recipients over 2000 to 2006, had similar findings: about 30 percent of EITC recipients over the period claimed the EITC only once, while only 11 percent claimed the EITC each year. Deena Ackerman, Janet Holtzblatt, and Karen Masken, “The Pattern of EITC Claims Over Time: A Panel Data Analysis,” Internal Revenue Service, 2009, http://www.irs.gov/pub/irs-soi/09resconpatterneitc.pdf.
[58] Dowd and Horowitz, 2011.
[59] Carl Davis et al., “Who Pays? A Distributional Analysis of the Tax Systems in All 50 States,” 5th Edition, Institute on Taxation and Economic Policy, January 2015, http://www.itep.org/whopays/full_report.php.
[60] Citizens for Tax Justice, “Who Pays Taxes in America?” April 7, 2014, http://www.ctj.org/pdf/taxday2014.pdf.
[61] One study finds that taxpayers who claimed the EITC at least once from 1989 through 2006 paid several hundred billion dollars more in federal income taxes over that period than they received in EITC benefits. Note, however, that the research covers a period before the Great Recession and the 2009 EITC expansion and that policy changes since the 1990s have reduced taxes for average taxpayers. Tim Dowd and John B. Horowitz, “The Earned Income Tax Credit: Safety Net or Bootstrap,” National Tax Association Conference on Taxation, Philadelphia, PA, November 21, 2008.
More from the Authors

Areas of Expertise


Areas of Expertise